
NUTS-CARE: An Analysis of Healthcare Services in Austria for Older Adults at a NUTS3 Level
- Published on
- Authors

- Name
- Victor Ademoyero
- @vickystickz
Introduction
Ageing demographics across Europe continue to put pressure on healthcare infrastructure, and Austria shows similar behaviour across the population. To optimize quality of life, there is a need to identify limitations to hospital accessibility and the healthcare network, particularly for older members of the community who are at greater risk of requiring timely or emergency medical services.
The NUTS-CARE project was initialized as a method of summarizing and quantifying key demographic spatial data to assist with the identification and subsequent action of state and federal health officials around shortcomings in services for older residents.
Study Area
At a sub-national (NUTS3) level, this project first identifies spatial trends in populations of older adults (60 years and older) across Austria. This is then correlated with average travel time to a hospital for that region in 2020. Discrepancies between areas of demographic significance and travel time may provide foci for future policy and action. The study also looks at household composition to identify areas of high-risk individuals — in particular, older adults who live alone and far from medical services.
Purpose & Benefits
The purpose is to provide an analysis of Austrian hospital travel times compared to population demographics (people aged 60 or older). The benefit is the ability to easily identify areas or subareas of concern, such as high-density older populations with long travel times to the nearest hospital, and similarly areas of older adults who do not live in family units but may experience long travel times.
The target audience is policy advisors at the Austrian state or federal level government, particularly in health, ageing, infrastructure and transport departments.
Data Preparation
Datasets
The datasets were acquired from openly available sources:
- Demographics — Eurostat Population on 1 January by age group, sex and NUTS 3 region
- Household data — Eurostat Population by country of birth, age groups, household status and NUTS 3 region
- Average hospital travel time — EEA Geospatial Average travel time to the nearest hospital in minutes, NUTS3 regions, 2020
- Hospital locations — ESPON Location of hospitals in Europe
The data was cleaned and filtered for relevancy using a series of Python scripts. The normalized Vulnerability Score data and relevant columns were centralized to a single file (household_status_60plus_by_region.csv) and used as a basis for the geo-database.
Vulnerability Score & Normalization
The Vulnerability Score (vb score) was created to visualize the key aspects of the acquired datasets in a condensed and easily understandable fashion. It was calculated per NUTS3 region using the following equation:
vb score = (average time to hospital × (over60 lives not in a family nucleus / total)) / number of hospitals in region
This provided a non-normalized value range which could be customized to gender (female, male, total). Higher values indicated higher vulnerability. To compare the different values, it was necessary to normalize the score:
normalized vb score = (x − vb score_min) / (vb score_max − vb score_min)
The normalized vb score takes the range [0, 1].
Methodology
Service Delivery Infrastructure
The service delivery infrastructure was abstracted into three distinct tiers: a Data tier, a Service tier, and an Application (client) tier. Where possible, open-source deployment was implemented. This pathway was selected as no commercial licensing overhead means minimal opex budget impact, making it easier to scale or redeploy the solution in other environments, and making the service overall more accessible downstream to a range of end-users.
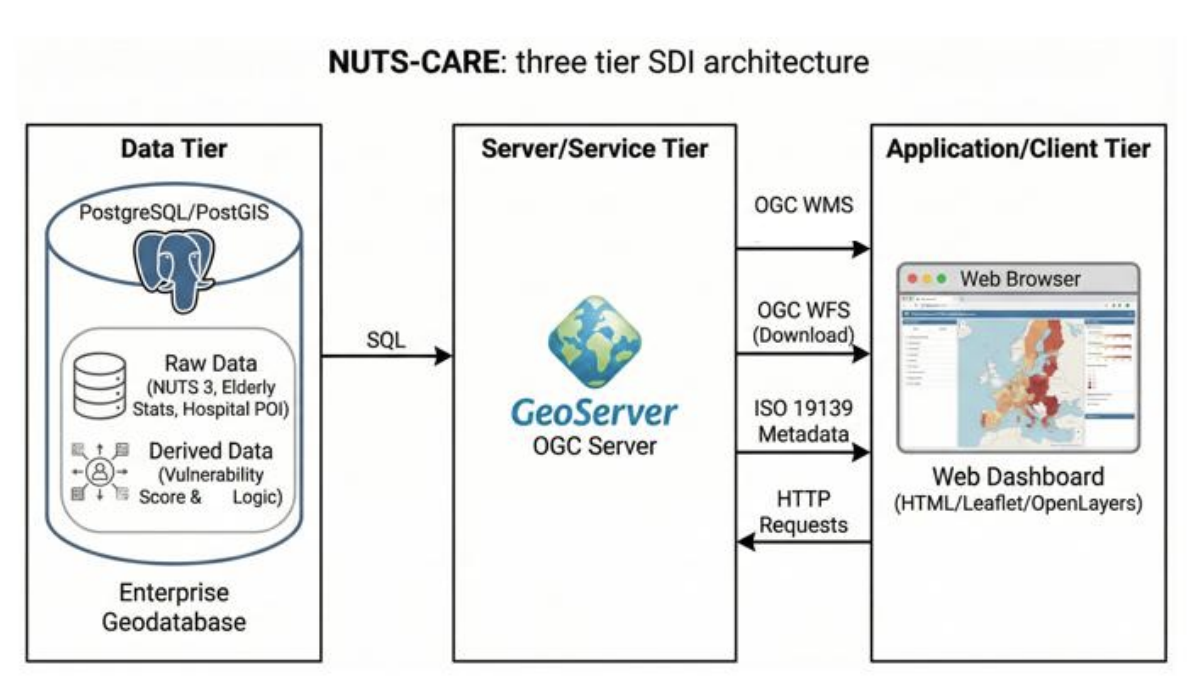
Fig 1.0 An overview of the NUTS-CARE system infrastructure, based on a three-tier open-source design.
Result
Step 1 — PostGIS Geo-database Setup
The normalized vb score and the values used in its calculation were indexed into a PostgreSQL database extended with PostGIS. This was hosted on the SDI class database server, with server permissions altered to allow other team members to edit and view the database.
Step 2 — GeoServer Configuration
The data in the data tier was loaded as Layers on the GeoServer. NUTS-CARE made use of the following GeoServer capabilities:
- Web Map Service (WMS) — allowing layers to be displayed as raster images
- Web Feature Service (WFS) — allowing layers to be displayed and features to be interacted with and queried
Step 3 — Metadata Standardization
Metadata was standardized according to ISO 19139. All metadata was formatted using ArcGIS Pro, though it is possible to achieve this via open-source methods. Metadata was produced for all three datasets used in the dashboard in both XML and HTML formats:
AT_NUTS3_Healthcare_VulnerabilityScore_60plusAT_health_care_centreAT_health_care_centre_travel_time
Step 4 — Web Dashboard Development
The application tier was responsible for providing the front-end user interface:
- Dashboard structure was provided using HTML
- Styling was done with a customized CSS stylesheet
- The interactive map was created with the OpenLayers JavaScript library
- The endpoint was hosted on Vercel, allowing full browser-based access and reducing overhead for users
Deployed Site: https://nuts-care.vercel.app/
Dashboard Github Repository: NUTS-care Dashboard
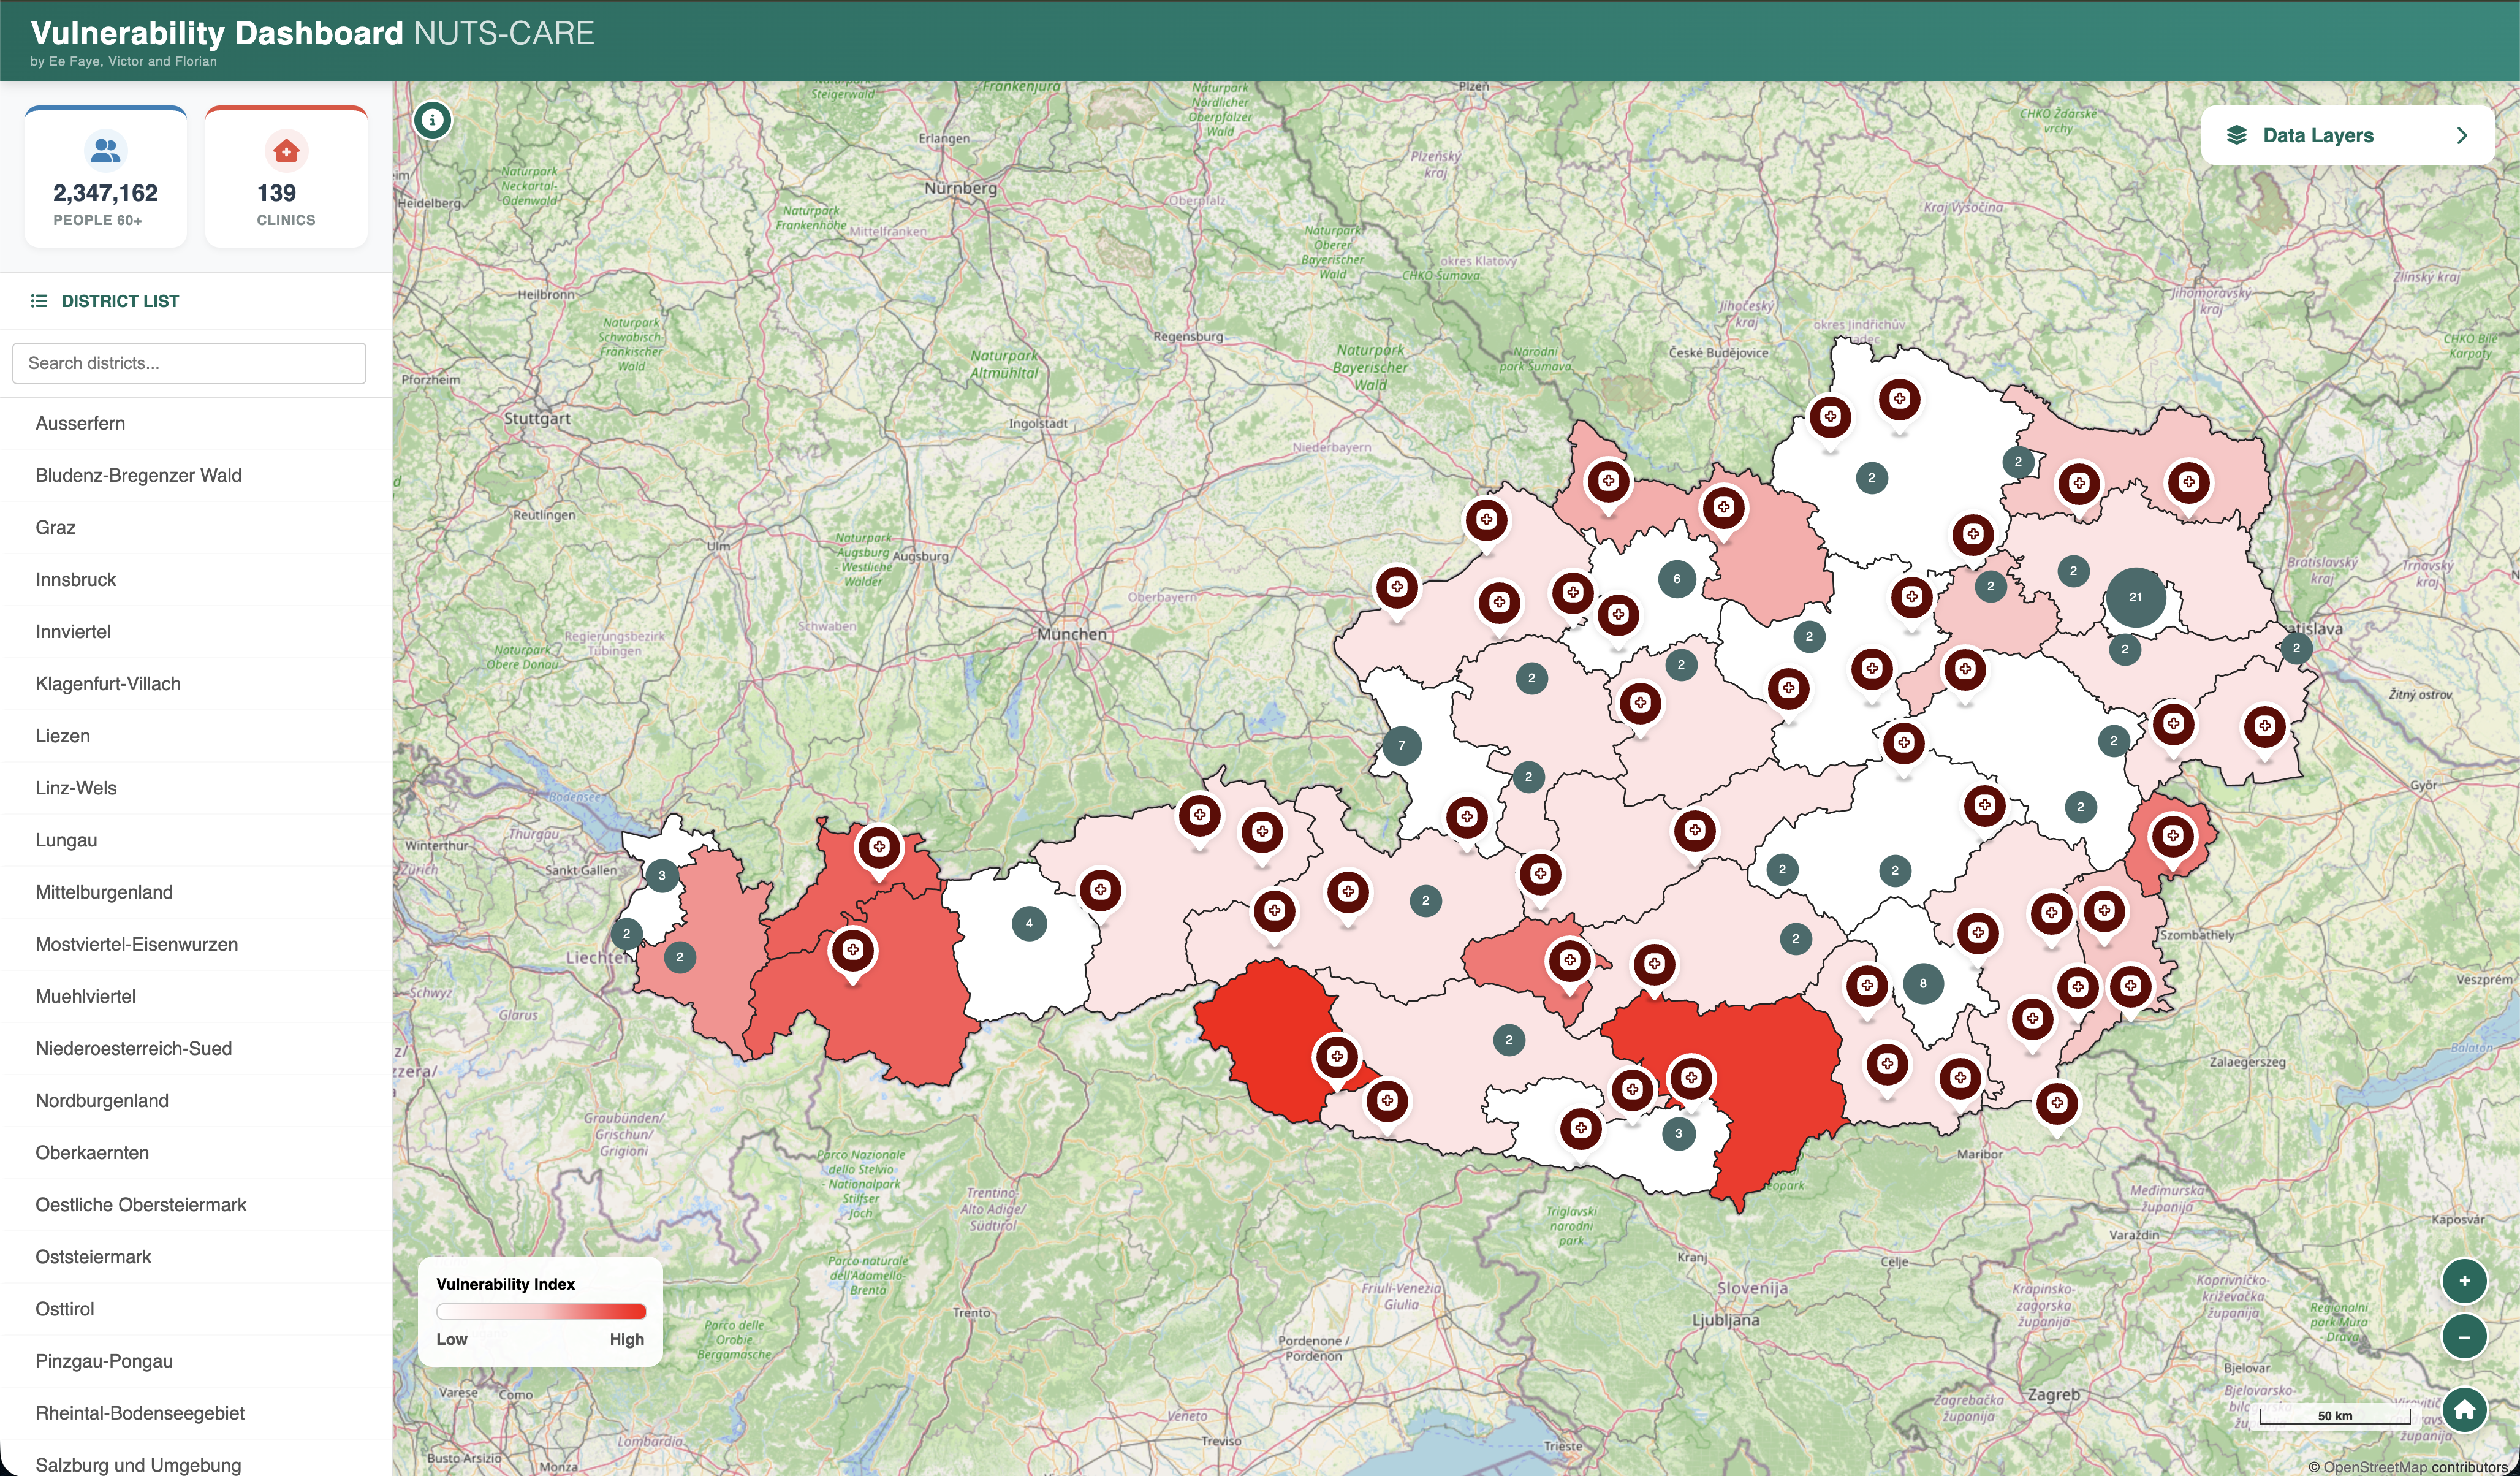
Fig 2.0 The NUTS-CARE user interface.
Project Management
The project was segmented into five work packages (WPs) with allotted time frames:
| WP | Name | Time Frame |
|---|---|---|
| 1 | Project management | 03.11.2025 – 16.11.2025 |
| 2 | Data integration | 17.11.2025 – 14.12.2025 |
| 3 | Spatial data infrastructure | 24.11.2025 – 09.01.2026 |
| 4 | Implementation and validation | 09.01.2026 – 18.01.2026 |
| 5 | Evaluation | 19.01.2026 – 08.02.2026 |
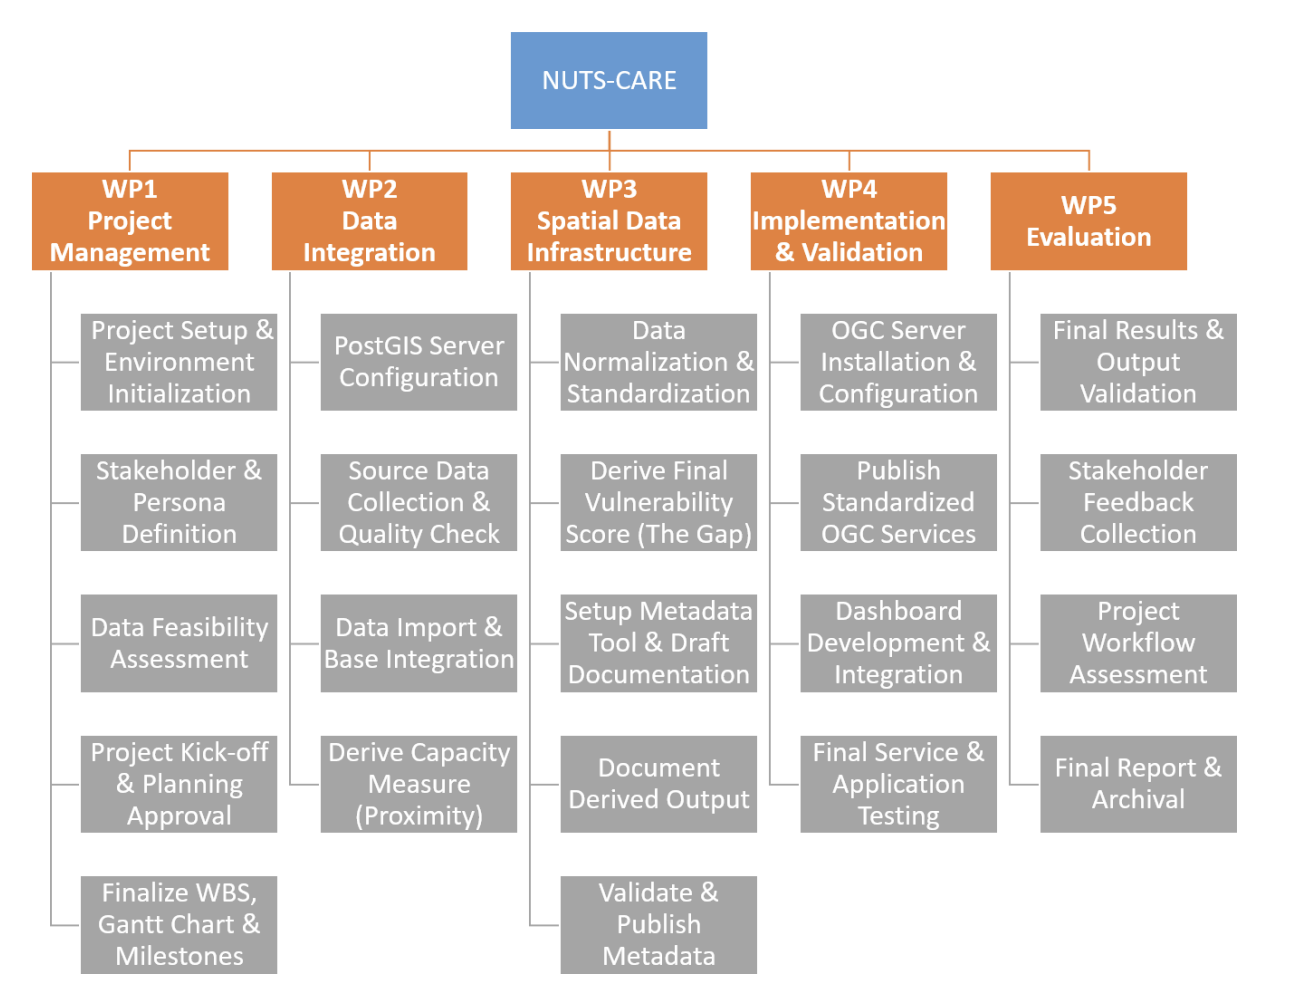
Fig 3.0 The Work Breakdown Structure included five work packages.
Personas
Personas were developed as a tool to identify key action areas and ensure the output was aligned with user and target audience needs:
- Korinna Schumann — Federal Minister for Labour, Social Affairs, Health, Care and Consumer Protection. Provides strategic leadership and policy direction in health, care, and social affairs.
- Marion Weigl — Head of Department of Health, Society and Equal Opportunities. Triages societal conditions that influence population health, focusing on vulnerable groups.
- Gerhard Fulop — Head of Department of Planning and System Development. Responsible for needs assessment and service range planning within the Austrian healthcare system.
- David Wachabauer — Head of Department of Primary Care and Care Coordination. Focused on strengthening primary care as the first point of contact for health-related questions.
Stakeholder Feedback
Stakeholder interviews were conducted to validate the project output. Overall, positive impressions of the NUTS-CARE implementation meant minimal changes for the current iteration:
- The Federal Minister found the map visualization far better than traditional spreadsheets for making the "care gap" real, and suggested a "Top 3 Priorities" summary widget.
- The Senior Researcher validated that the NUTS-3 level is an excellent first-step for national patterns, and suggested distinguishing between acute care and rehabilitation centres.
- The Capacity & Resource Planner appreciated the tool for consolidating cross-referencing of multiple files, and requested capacity metrics such as "Beds per senior" ratio instead of simple hospital count.
- The Primary Care Worker liked visualizing abstract ideas like "accessibility", identified some "care deserts", and requested a GP density layer.
Internal Evaluation
The internal project team noted that the clear separation of the Data Tier and Client Tier enabled efficient parallel development. Communication channels were well-established and the open-source SDI approach using OpenLayers and GeoServer offered flexibility in dashboard design.
Areas for improvement included: some unnecessary frontend rework due to late definition of the final database output schema, initial confusion about the scope of project demands, and the limitation of focusing mainly on 2020 datasets rather than performing temporal comparisons across multiple years.
Non-Goals
The project explicitly did not aim to provide potential locations of new hospitals, identify non-hospital medical services (such as GP clinics or physiotherapy providers), or provide insight into specifics of hospital services like bed capacity. These were identified as potential extensions of scope for future investigations.
Summary
The NUTS-CARE project successfully created a user-interface dashboard platform displaying the Vulnerability Score — as well as other relevant spatial data layers — using a three-tier technology stack, in a transparent and mostly open-source way. Feedback and evaluation was conducted both with relevant stakeholders, such as ministry officials, as well as within the team, confirming the project is fit for purpose.
Credits
This project was completed as part of the CDE 1st Semester course SDI Services Implementation at the University of Salzburg. The project was completed in a team of three members:
- Florian Winkler — Principal Investigator
- e Faye Chong — Contractor and Communications Lead
References
- Eurostat (2021) Census 2021 — Population on 1 January by age group, sex and NUTS 3 region. Available at: https://ec.europa.eu/eurostat
- Eurostat (2021) Census 2021 — Population by country of birth, age groups, household status and NUTS 3 region. Available at: https://ec.europa.eu/eurostat
- EEA (2020) Geospatial Average travel time to the nearest hospital in minutes, NUTS3 regions. Available at: https://www.eea.europa.eu
- ESPON Location of hospitals in Europe. Available at: https://www.espon.eu
- NUTS-CARE Dashboard. Available at: https://nuts-care.vercel.app/
- NUTS-CARE Project Repository. Available at: https://git.sbg.ac.at/s1116806/nuts-care/