
MedAccess Austria - A WebGIS Application for Analyzing Healthcare Accessibility in Austria
- Published on
- Authors

- Name
- Victor Ademoyero
- @vickystickz
Overview
MedAccess Austria is a WebGIS application developed to analyze and visualize accessibility to healthcare facilities across Austria. The platform enables users to interactively assess population coverage within user-defined buffer distances around healthcare facilities, providing insights for healthcare planning, policy development, and resource allocation.
The system dynamically integrates geospatial data and real-time geo-processing to estimate the number of residents who have access to healthcare facilities within specified distances (e.g., 500m, 1km, 5km, 10km).
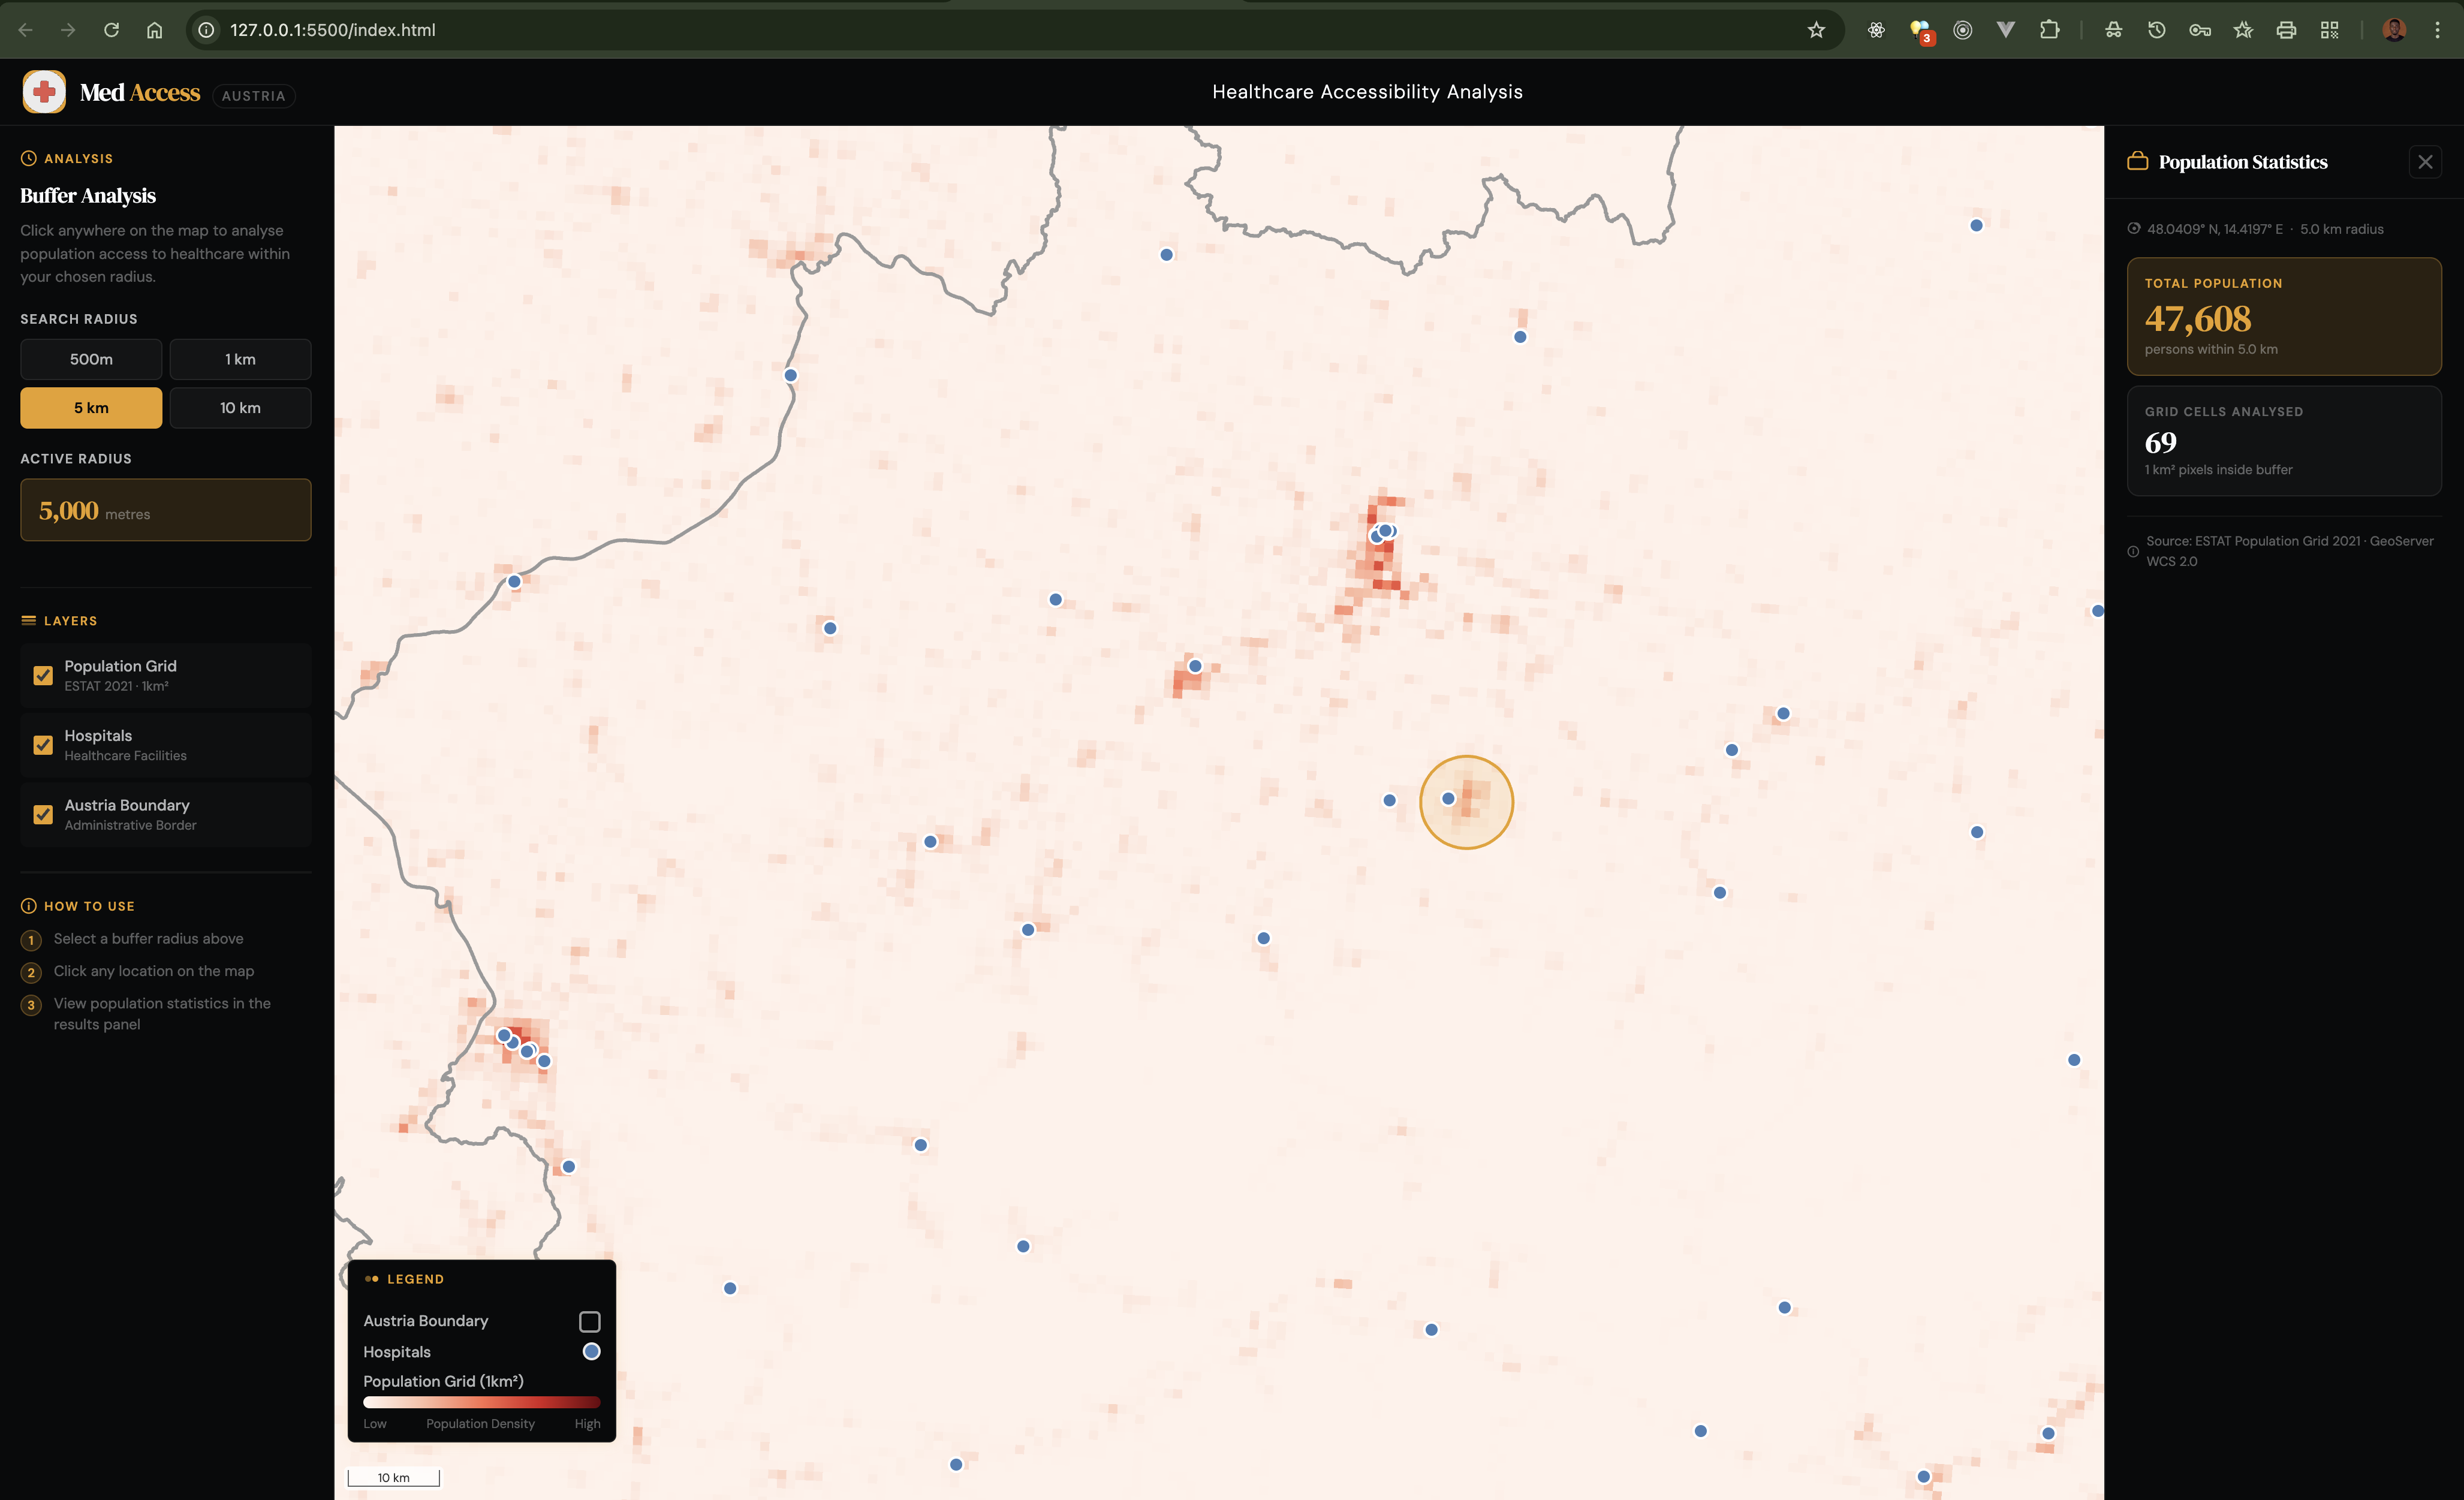
Fig 1.0 MedAccess Austria Web Interface
Objectives
- Analyze spatial accessibility of residents to healthcare services in Austria using a geo-processing technique.
- Estimate population coverage within defined proximity or area to healthcare facilities within Austria.
- Make available an interactive and user-friendly WebGIS platform for evidence-based healthcare planning and decision-making.
Github Repository: MedAccess
Tools/Technology Used
HTML(HyperTextMarkupLanguage): HyperTextMarkup Language is used to structure the web application interface layout
CSS(CascadingStyleSheet): Used for styling the webpage, map control appearance, legend and the overall user interface
JavaScript: The main language used for implementing the application logic and manipulating user interface based on interactivity. .
OpenLayers (v7.4.0): The mapping javascript library used for the following
- Render all layers( Vector, Raster and OSM basemap).
- To integrate the OGC Services (WFS, WMS and WCS) from Geoserver
- Display and manage map layers.
- To control map navigation like Zoom in and out, Map reset and Scale
- To handle user clicks and hover event on the map and buffer generation
GeoServer: the open-source server used to publish layers used for the projects. It was used for the following:
- The server engine used to host the datasets and publish the layers for as web services.
- Serve data via WMS (Web Map Service), WFS (Web Map Service) and WCS (Web Coverage Service).
- To make buffer bounding box requests for raster pixel value extraction with the Web Coverage Service GeoTIFF Library (v2.1.3): The library is used for reading and processing the population grid raster received from the Geoserver on the client-side for population estimation.
Data used
The following datasets were prepared with QGIS in appropriate formats and uploaded to GeoServer (Local and Online Geoserver):
-
Census 2021 Grid Raster (1 km² ) - (.tiff) Source: EuroStat Population Grid 2021
-
Healthcare Facilities in geopackage (.gpkg) Source: ESPON Database- Locations of hospitals in Europe 2021
-
Austria Boundary in geopackage (.gpkg) Source: European data - Administrative Boundaries (VGD) BEV Reference Date 1.4.2023
Features
- Display layers: Europe Total Population Grid raster 2021, hospitals in Austria, Austria boundary visualization and OSM basemap layer.
- Interactive selection of the buffer (500m, 1km, 5km, 10km).
- Map Controls: Zoom in, Reset map and Zoom Out
- Automatic legend updates based on selected layers.
- Scale of the map dynamically displayed according to Zoom level.
- Shows buffer zone layer when the user clicks on the map
- Perform WCS request to retrieve raster pixels within buffer extent.
- Extraction of raster pixel values within the of bounding box the generated buffer zone layer
- Shows the total population and number of raster cell analyzed within the buffer zone
Methodology (Technical Workflow)
The development of MedAccess Austria followed a structured geospatial and web-mapping workflow integrating frontend technologies with server-side geospatial services.
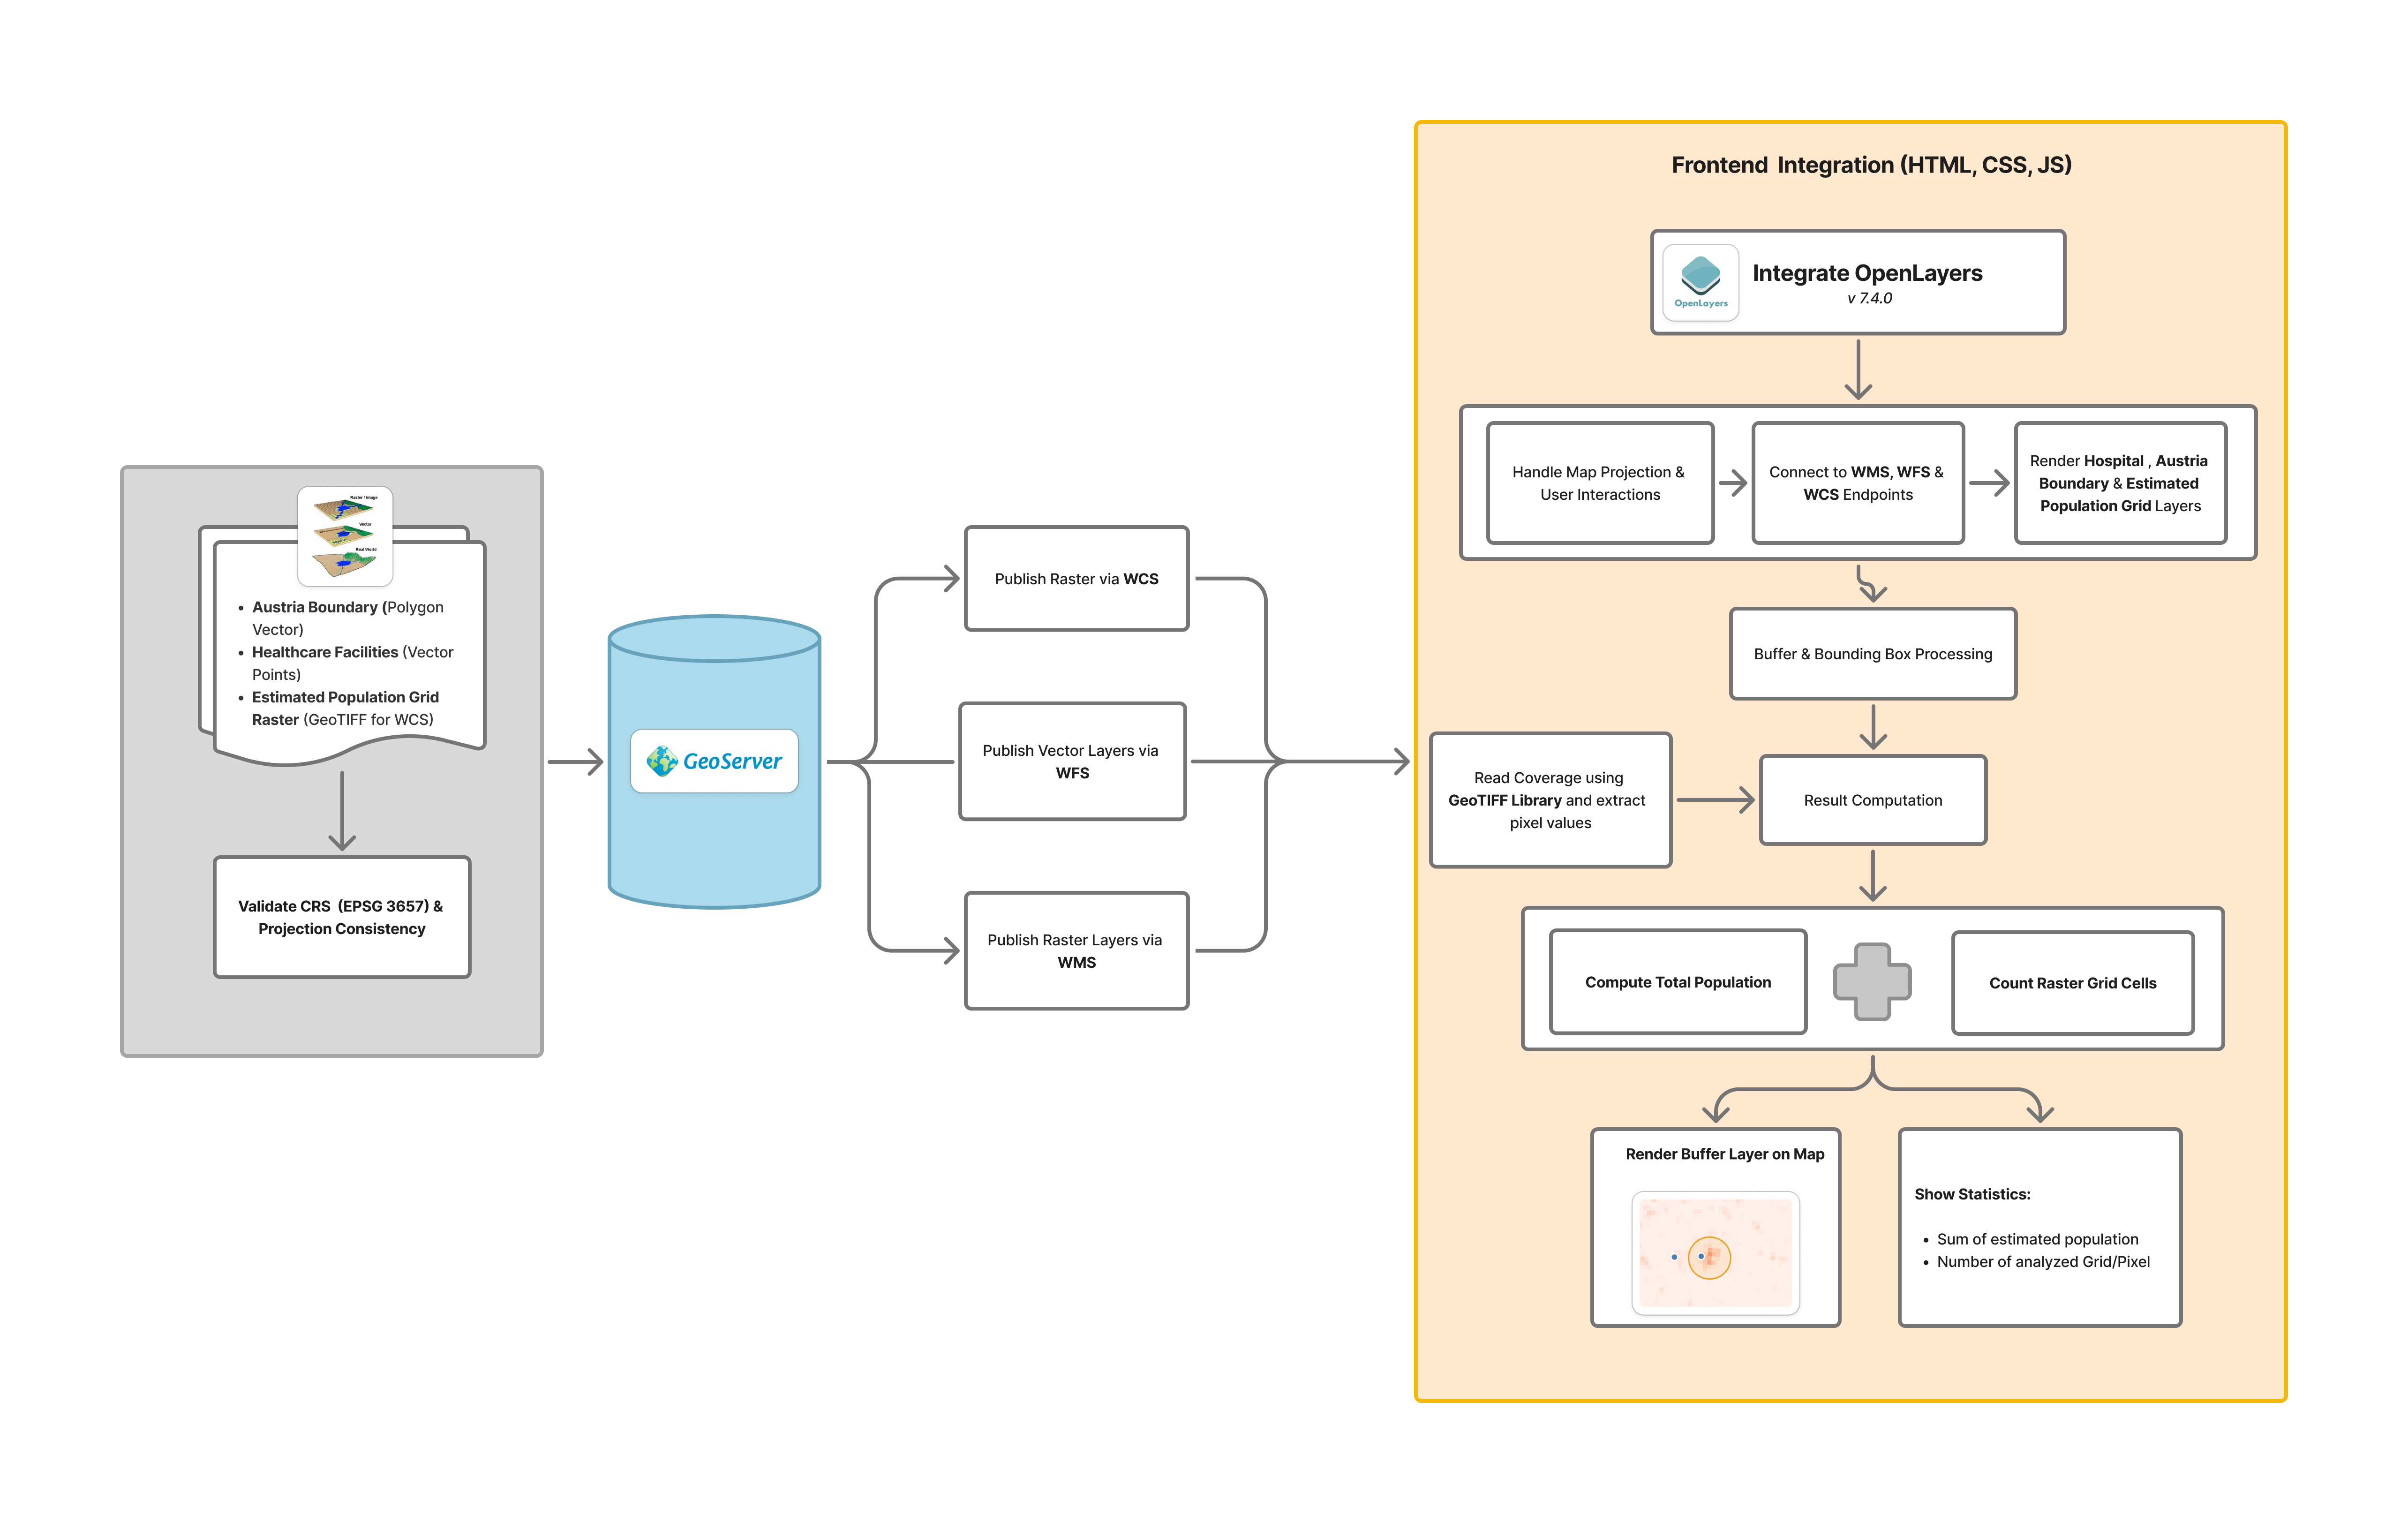
Fig 2.0 Methodology Work Flow
Data Preparation
All datasets were first prepared with QGIS in appropriate spatial formats and projected to EPSG:3857 (WGS 84 / Pseudo-Mercator), a standard projected coordinate system for web mapping.
- The Census 2021 population raster (1 km² grid) was formatted as a GeoTIFF suitable for WCS publishing.
- To style the raster layer, the style was exported in .sld format which would be used in Geoserver.
- Healthcare facilities were prepared as a vector point layer in geopackage format.
- The Austria boundary layer was prepared as a polygon vector dataset in geopackage format.
GeoServer Configuration
In development, a local Geoserver was configured and the prepared layers were added to different stores. To publish the layers from the stores the following OGC Services were enabled: Web Map Service (WMS), Web Feature Service (WFS) and Web Coverage Services (WCS).
Separate stores were created for all layers based on the datasets format and the appropriate bounding boxes and coordinate reference system were defined for each.
- The Estimate Population Grid Raster was published with the GeoTiff store.
- Austria Boundary and Hospital Layers was published with the GeoPackage store.
In the final code submission, the available online Geoserver - https://geoserver22s.zgis.at/geoserver/ by the school was used to publish only the vector layers for easy access without the need to set up a local geoserver to test the application.
Web Map (Frontend) Integration
The web interface was built using HTML, CSS, and JavaScript. OpenLayers was integrated to perform the following:
- To create the WFS, WMS and WCS url using the server baseurl and layer names.
- To render layers dynamically and ensure users can make each layer visible or not.
- To maintain map projection and coordinate for all layers.
- To handle all kinds of spatial interactions, buttons and such as click, hover events and rendering of results after necessary computations.
Buffer and Bounding Box Processing
When a user toggles a buffer distance and clicks on the map or exactly at one of the hospital points, Open Layer helps to perform the following:
- Using the active radius size i.e either 500m, 1km, 5km or 10km, it generates a buffer geometry immediately on the map around the selected point or location on the map.
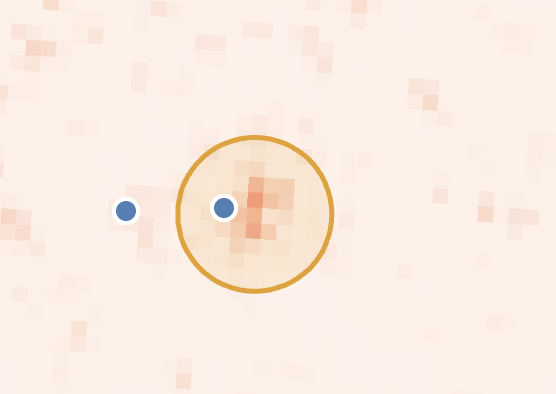
Fig 2.0 Methodology Work Flow
- To perform the buffer analysis and population the geometry boundary box (bbox) is then calculated and used to create a Web Coverage Service request of the ESTAT_OBS-VALUE-T_2021_V2 raster layer.
Raster Data Retrieval and Processing
Once the Web Coverage Service request is successful and retrieves the pixels within the buffer bounding box, the external GeoTIFF library is used to read the raster one by one to extract the pixel values (representing population per 1 km² grid cell).
Finally, all pixel values are then summed up to calculate the total population within the buffer zone.
Result Computation and Display
To display the computed total population value computed, a side panel display is the populated with information to show the following:
- Estimated Total Population.
- The total number of raster grid cells analyzed.
- The buffer zone is overlaid on the map.
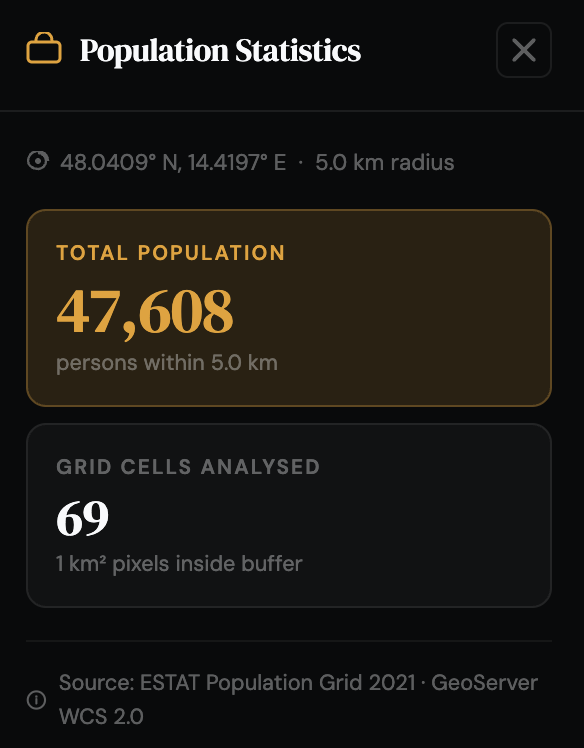
Fig 2.0 Side panel display showing the Estimated Total Population and the total number of raster grid cells analyzed within the selected buffer zone.
How it works
Watch how the application works in the video below:
Challenges
Based on the initial idea of the project, it was planned to use Web Processing Service (WPS) to perform the buffer analysis and calculate the estimated population value on the Geoserver but this method requires the following:
- Install the Web Processing Service (WPS) Plugin on the Geoserver.
- Install the gs:BufferFeatureCollection facility points and gs:ZonalStatistics on the geoserver.
- A good knowledge of writing a dynamic XML document for performing this process.
- Properly handling raster data retrieval using WCS method.
- To ensure accurate buffer bounding box extraction for population estimation from the raster.
- Optimizing performance for real-time geoprocessing because it is all done on the client side.
AI Use Disclaimer
Artificial Intelligence tools were used to generate the initial page layout and CSS styling and also to understand how to sum up pixel values from the EstimatePopulationGrid raster layer using GeoTiff javascript library. The generated result was reviewed and modified to meet the need for the WebGIS Application