Internship Report: Geospatial Frontend Development at HeiGIT, Heidelberg Institute for Geoinformation Technology
- Published on
- Authors

- Name
- Victor Ademoyero
- @vickystickz
Introduction
This report documents my internship at Heidelberg Institute for Geoinformation Technology gGmbH (HeiGIT), completed between 1 July 2026 and 31 August 2026, as part of my studies in the Department of Geoinformatics at Paris Lodron Universität Salzburg (PLUS). The internship was carried out under the supervision of Prof. Alexander Zipf, Chair of GIScience at Heidelberg University and Scientific Director of HeiGIT, with an agreed weekly working time of 40 hours, completing the required 300 internship hours in full.
HeiGIT is an affiliated institute of Heidelberg University working closely with the GIScience Research Group. It conducts applied research and development in geoinformatics to support decision making in sustainable mobility, humanitarian aid, and climate action, underpinned by big spatial data analytics and machine learning. Within this environment, I worked as a geospatial frontend engineer, contributing to the development of tools and interfaces that support humanitarian mapping efforts.
This report gives an overview of the tasks and responsibilities I carried out, reflects on the learning and professional objectives I set for myself, describes the projects I contributed to and their outcomes, and offers a self evaluation of the experience. It also covers the challenges I faced and what I learned from them, and closes with recommendations for future interns at HeiGIT.
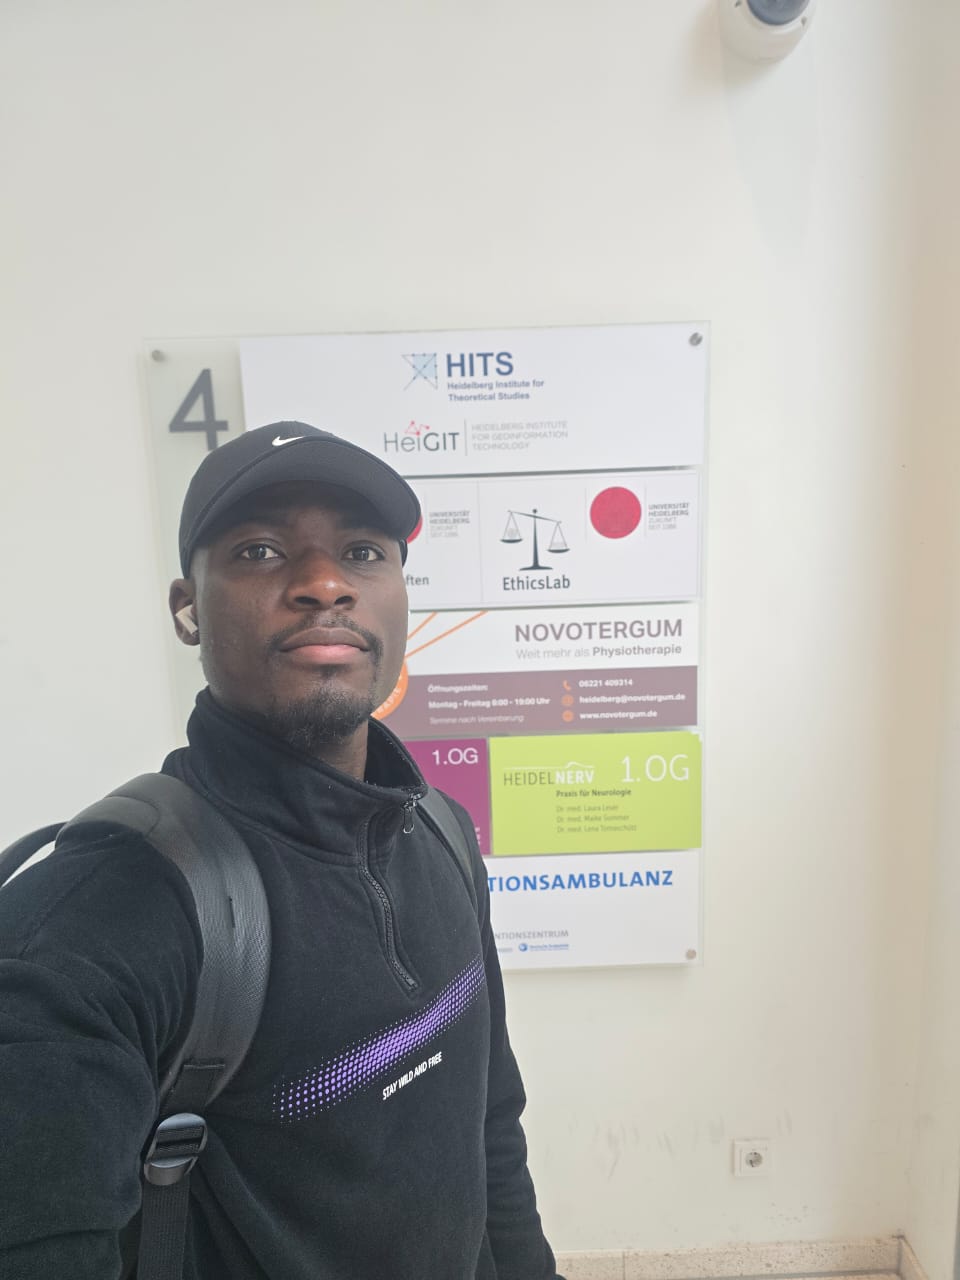
Figure 1.0 My First day at Heigit
Tasks and Responsibilities
During my internship as a Geospatial Frontend Intern with the Geoinformation for Humanitarian Aid (Disaster Team) at HeiGIT, I was involved in a range of tasks connected to the development and maintenance of tools supporting disaster risk assessment and humanitarian response. My core responsibilities included:
- Weekly Disaster Team meeting: I attended the weekly meeting with the full Disaster Team, where each member gave a general update on their work from the previous week and outlined what they planned to accomplish in the week ahead.
- Weekly DIRC update meeting: I took part in the weekly update meeting with the project manager, Alec, and team members Valentin and Mert. In this meeting, we discussed and shared updates on the DIRC and planned how to technically implement specific features on the dashboard. This often involved brainstorming and suggesting the best approach to meet user needs when building out new functionality.
- Monthly Jour Fixe: I attended two Monthly Jour Fixe sessions, in July and August. This meeting brings together a wider group of stakeholders from HeiGIT and the Department of GIScience at Heidelberg University to present work and products ready for production, review and plan project and deployment needs across HeiGIT instances, and share research achievements and applications across teams.
- Disaster Risk Composer (DIRC) Dashboard development: I mostly contributed to the development of the DIRC dashboard, working on the frontend components used to visualize and interact with disaster risk data. This included developing the Risk Dimensions view, which presents results for each risk dimension (exposure, vulnerability, and Lack of coping capacity); implementing the Indicator Metadata and Trust Panel, giving users visibility into what each indicator measures and how trustworthy the underlying data is; implementing a custom indicator weighting upload feature; and adding information tooltips explaining the individual indicators.
- DIRC Story Map layout and configuration: I worked on the layout and configuration of the DIRC Story Map, helping shape how disaster risk information is presented and communicated to users in a clear and accessible narrative format. The configuration was built to be reusable, allowing it to serve as a foundation for future story maps as well.
- Geospatial data pipeline development: I built a geospatial pipeline to aggregate Natura2000 imperviousness data across different countries, supporting analysis of land surface sealing within protected natural areas. This project serves as my learning outcome from two weeks of learning how to use dagster from dagster university and understanding how HeiGIT uses this pipeline framework for their geospatial workflow.
3.0 Learning and Professional Experiences
While preparing for this internship, I set myself three main objectives: to contribute to real-world projects supporting humanitarian aid, to learn new skills and best practices in building GIS applications from experienced engineers, and to gain hands-on work experience in the European geospatial industry.
To support these objectives, I aimed to apply and further develop the following skills at HeiGIT:
- Software development skills to build a functional WebGIS portal
- Project management skills
- Programming skills in JavaScript and Python
- Remote sensing knowledge
- Cartography skills
Technical and Soft Skills developed
Over the course of the internship, I developed the following technical skills:
- Working with Dagster for geospatial pipeline development
- Using Python for ETL (Extract, Transform, Load) processes
- Building dashboard interfaces with the Vue.js frontend framework
- Handling raster data formats when rendering them on web maps
Alongside these technical skills, I also developed several soft and workflow related skills:
- Improved project management skills
- Tagging versions on GitHub
- Setting up GitHub workflows for deployment
- Creating and managing Node Package Manager (npm) packages
- Presenting information effectively through story maps
- Writing tests for code reliability
Transfer of Theoretical Knowledge
During my first and second semesters at PLUS, I built a strong theoretical foundation that directly supported my work at HeiGIT. The course Copernicus in Digital Earth (EO&GI) introduced me to Copernicus services, while Advanced Remote Sensing and Digital Earth: Big Earth Data Analysis and Modeling deepened my understanding of remote sensing analysis, including the concept of imperviousness in the context of Natura2000 areas, an idea I later built on and applied directly when developing the geospatial pipeline during my internship.
On the practical side, Practice: Software Development (Python) and Basics of Software Development gave me hands-on experience and theoretical grounding in what it takes to build GIS applications, including practice with Python and JavaScript for geospatial analysis. This prepared me well to tackle my tasks at HeiGIT and to communicate effectively with other team members on technical matters.
Advanced Cartography also played an important role, teaching me how to design map layouts and tell stories clearly through maps. This knowledge translated directly into my work on the DIRC Story Map, where I applied the same principles of choosing the right layout and structure to help users understand disaster risk information clearly.
Altogether, these courses gave me both the theoretical background and the practical skills needed to contribute meaningfully to real projects at HeiGIT from early on in my internship.
Professional Growth and Insight
Beyond the technical and soft skills I developed, this internship gave me valuable insight into how humanitarian GIS work translates into real world impact. I learned more about how HeiGIT coordinates response and application development in partnership with the Red Cross in several African countries, and how tools such as OpenRouteService, MapSwipe, Sketch Map Tool, and DIRC are used together to support disaster response coordination on the ground.
This exposure helped me understand that building a single tool is only part of the picture. Effective humanitarian response depends on how well different tools and data sources fit into a larger ecosystem, from routing and logistics with OpenRouteService, to crowd-sourced satellite image analysis with MapSwipe, to participatory community mapping with Sketch Map Tool, to risk composition and communication with DIRC. Seeing how these pieces connect gave me a much clearer picture of the end users I was designing for, disaster responders, local communities, and decision makers who rely on accurate and accessible information under time pressure.
This experience also grew my appreciation for interdisciplinary collaboration. Working alongside colleagues with backgrounds in remote sensing, data science, and humanitarian coordination showed me how important it is for a geospatial frontend engineer to understand not just the code, but the context and the people the tools are ultimately built for. It reinforced my interest in continuing to work at the intersection of technology and humanitarian aid, and gave me a stronger sense of purpose in the kind of geospatial work I want to pursue going forward.
Project Duties and Outcomes
During my internship, I worked on two main projects: development of the DIRC Dashboard, configuration of the DIRC Story Map, and development of a geospatial pipeline for aggregating country Natura2000 imperviousness results. Each is described in more detail below.
DIRC Dashboard Development
My main duty on the DIRC Dashboard was building out the frontend components that let users visualize and interact with disaster risk data. This included developing the Risk Dimensions view, which presents results for each of the three risk dimensions, exposure, vulnerability, and coping capacity, in a way that is easy for users to interpret. I also implemented the Indicator Metadata and Trust Panel, which gives users transparency into what each indicator measures and how trustworthy the underlying data is, an important feature for building user confidence in the tool. In addition, I built a custom indicator weighting upload feature, allowing users to adjust how different indicators are weighted in the risk calculation according to their own needs, and added information tooltips throughout the dashboard to explain individual indicators clearly.
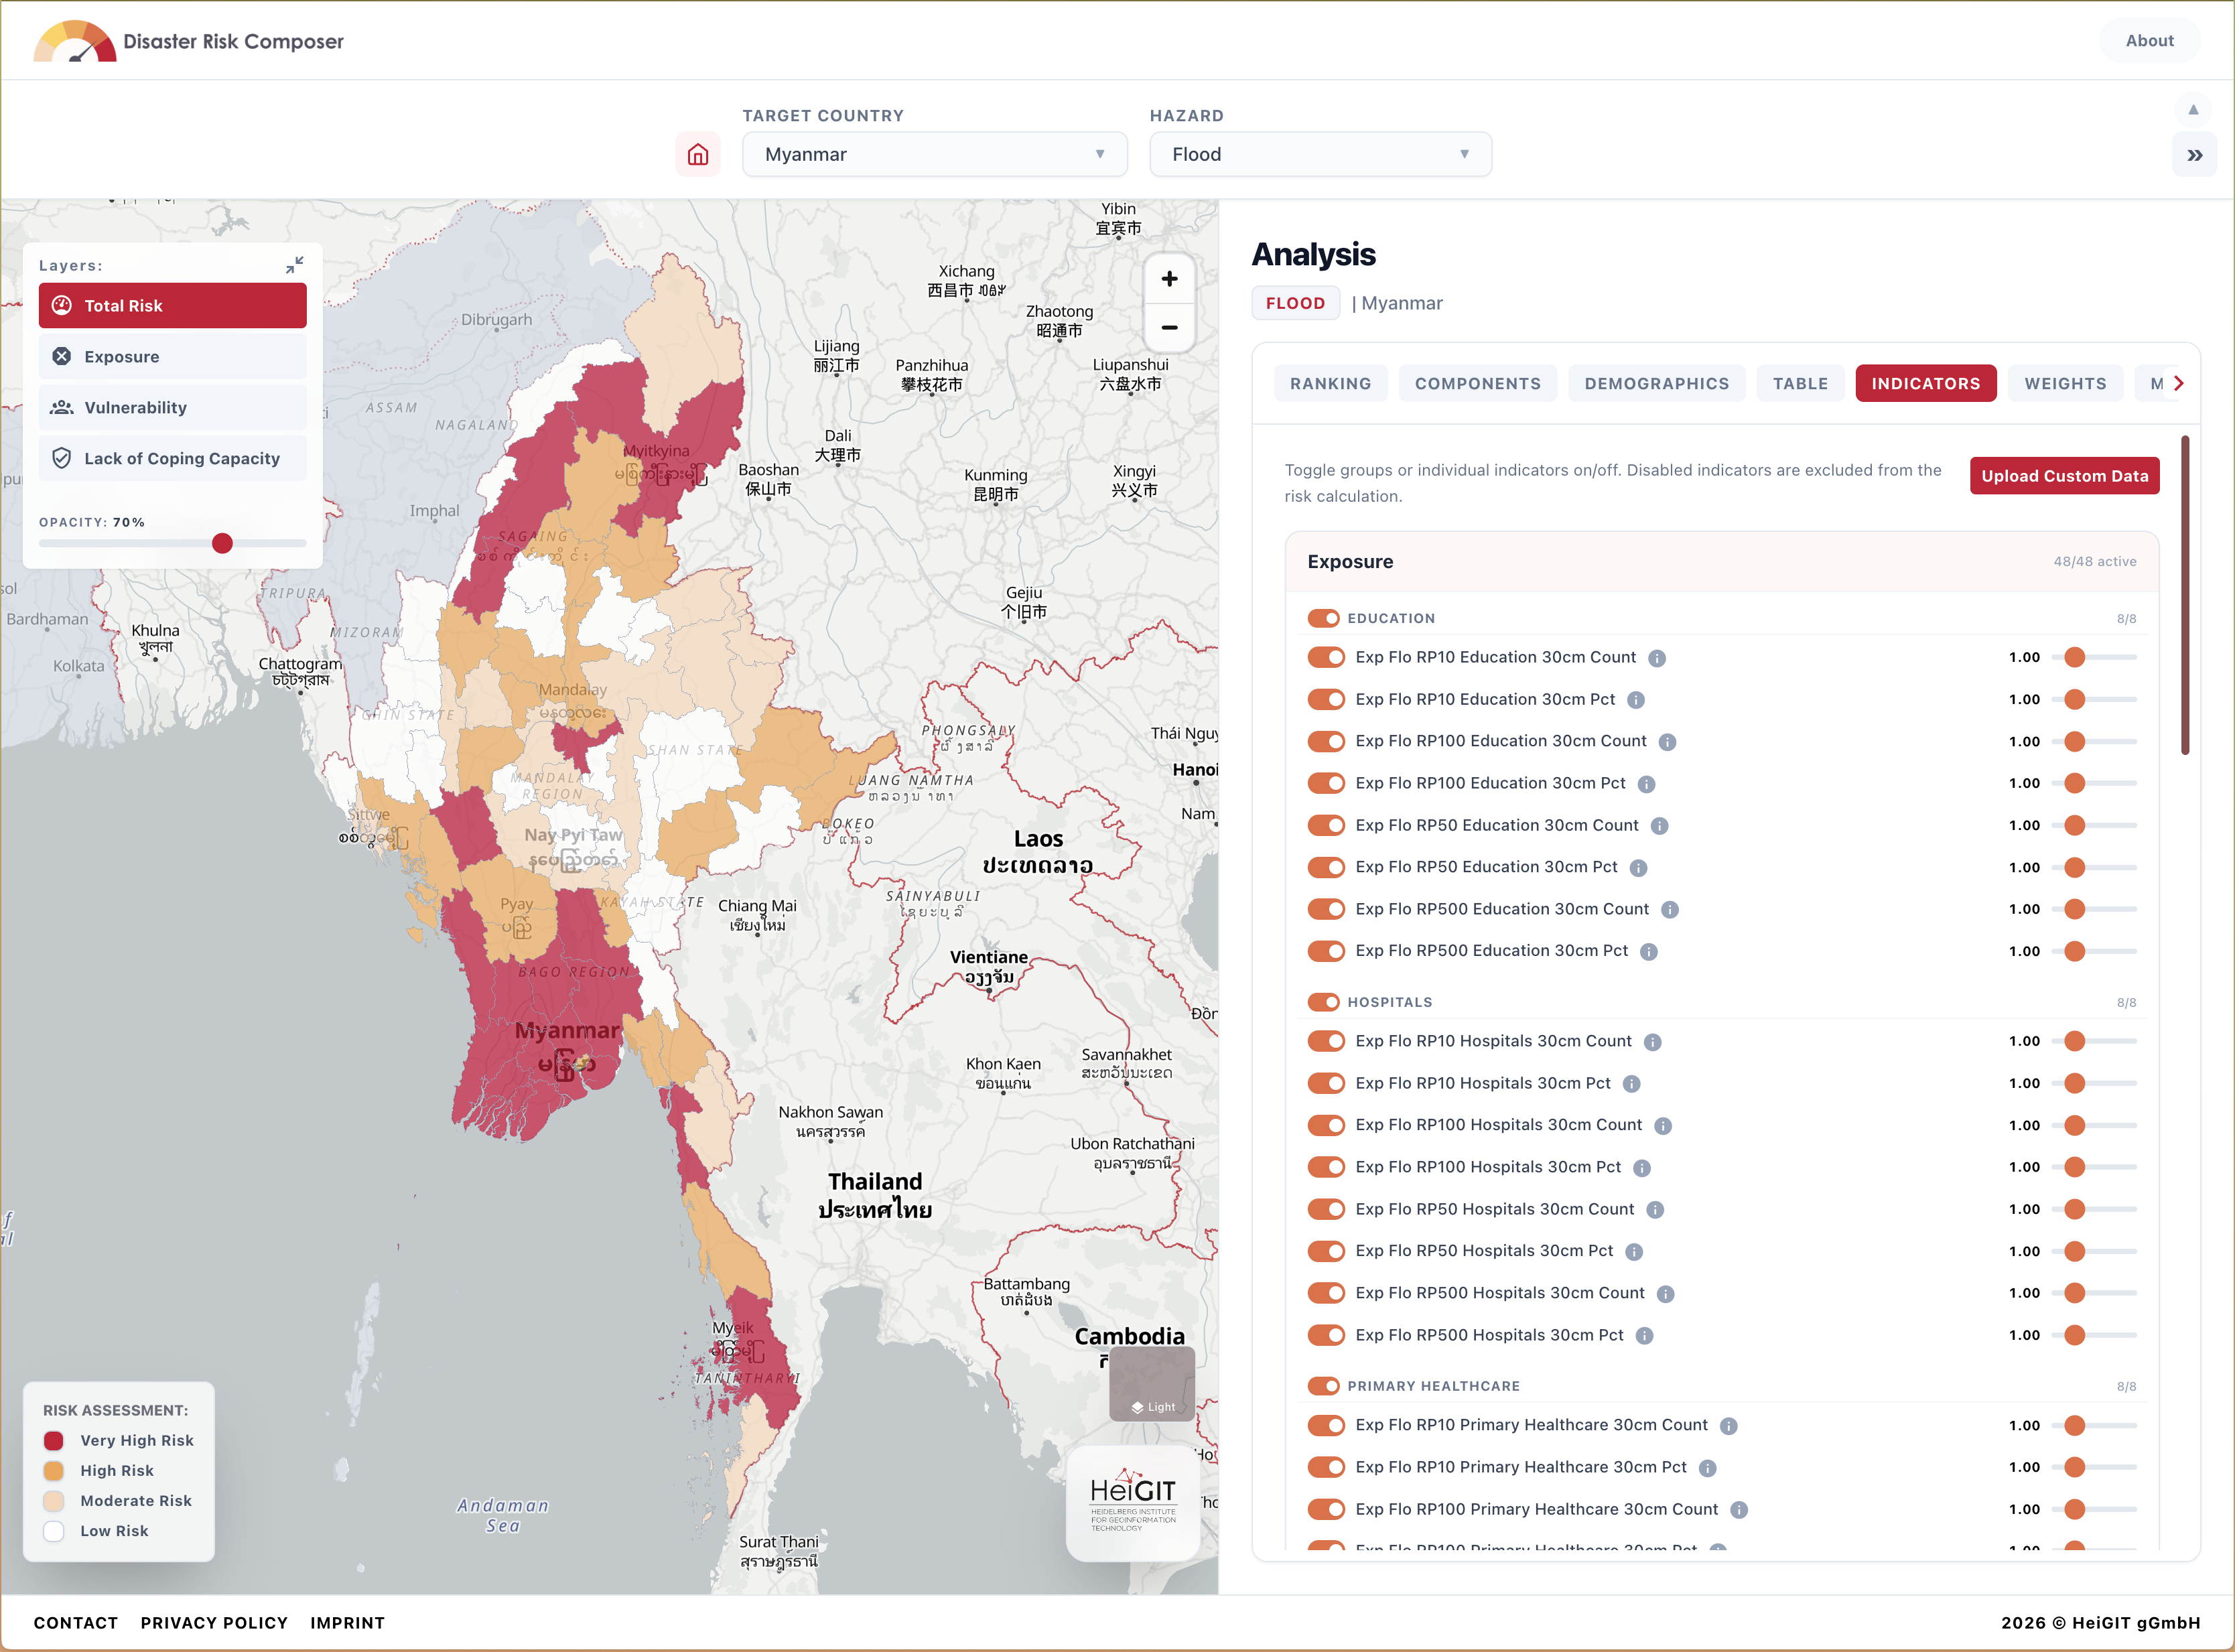
Figure 2.0 DIRC Risk dimension view ( Exposure, Vulnerability, and Lack of Coping Capacity)
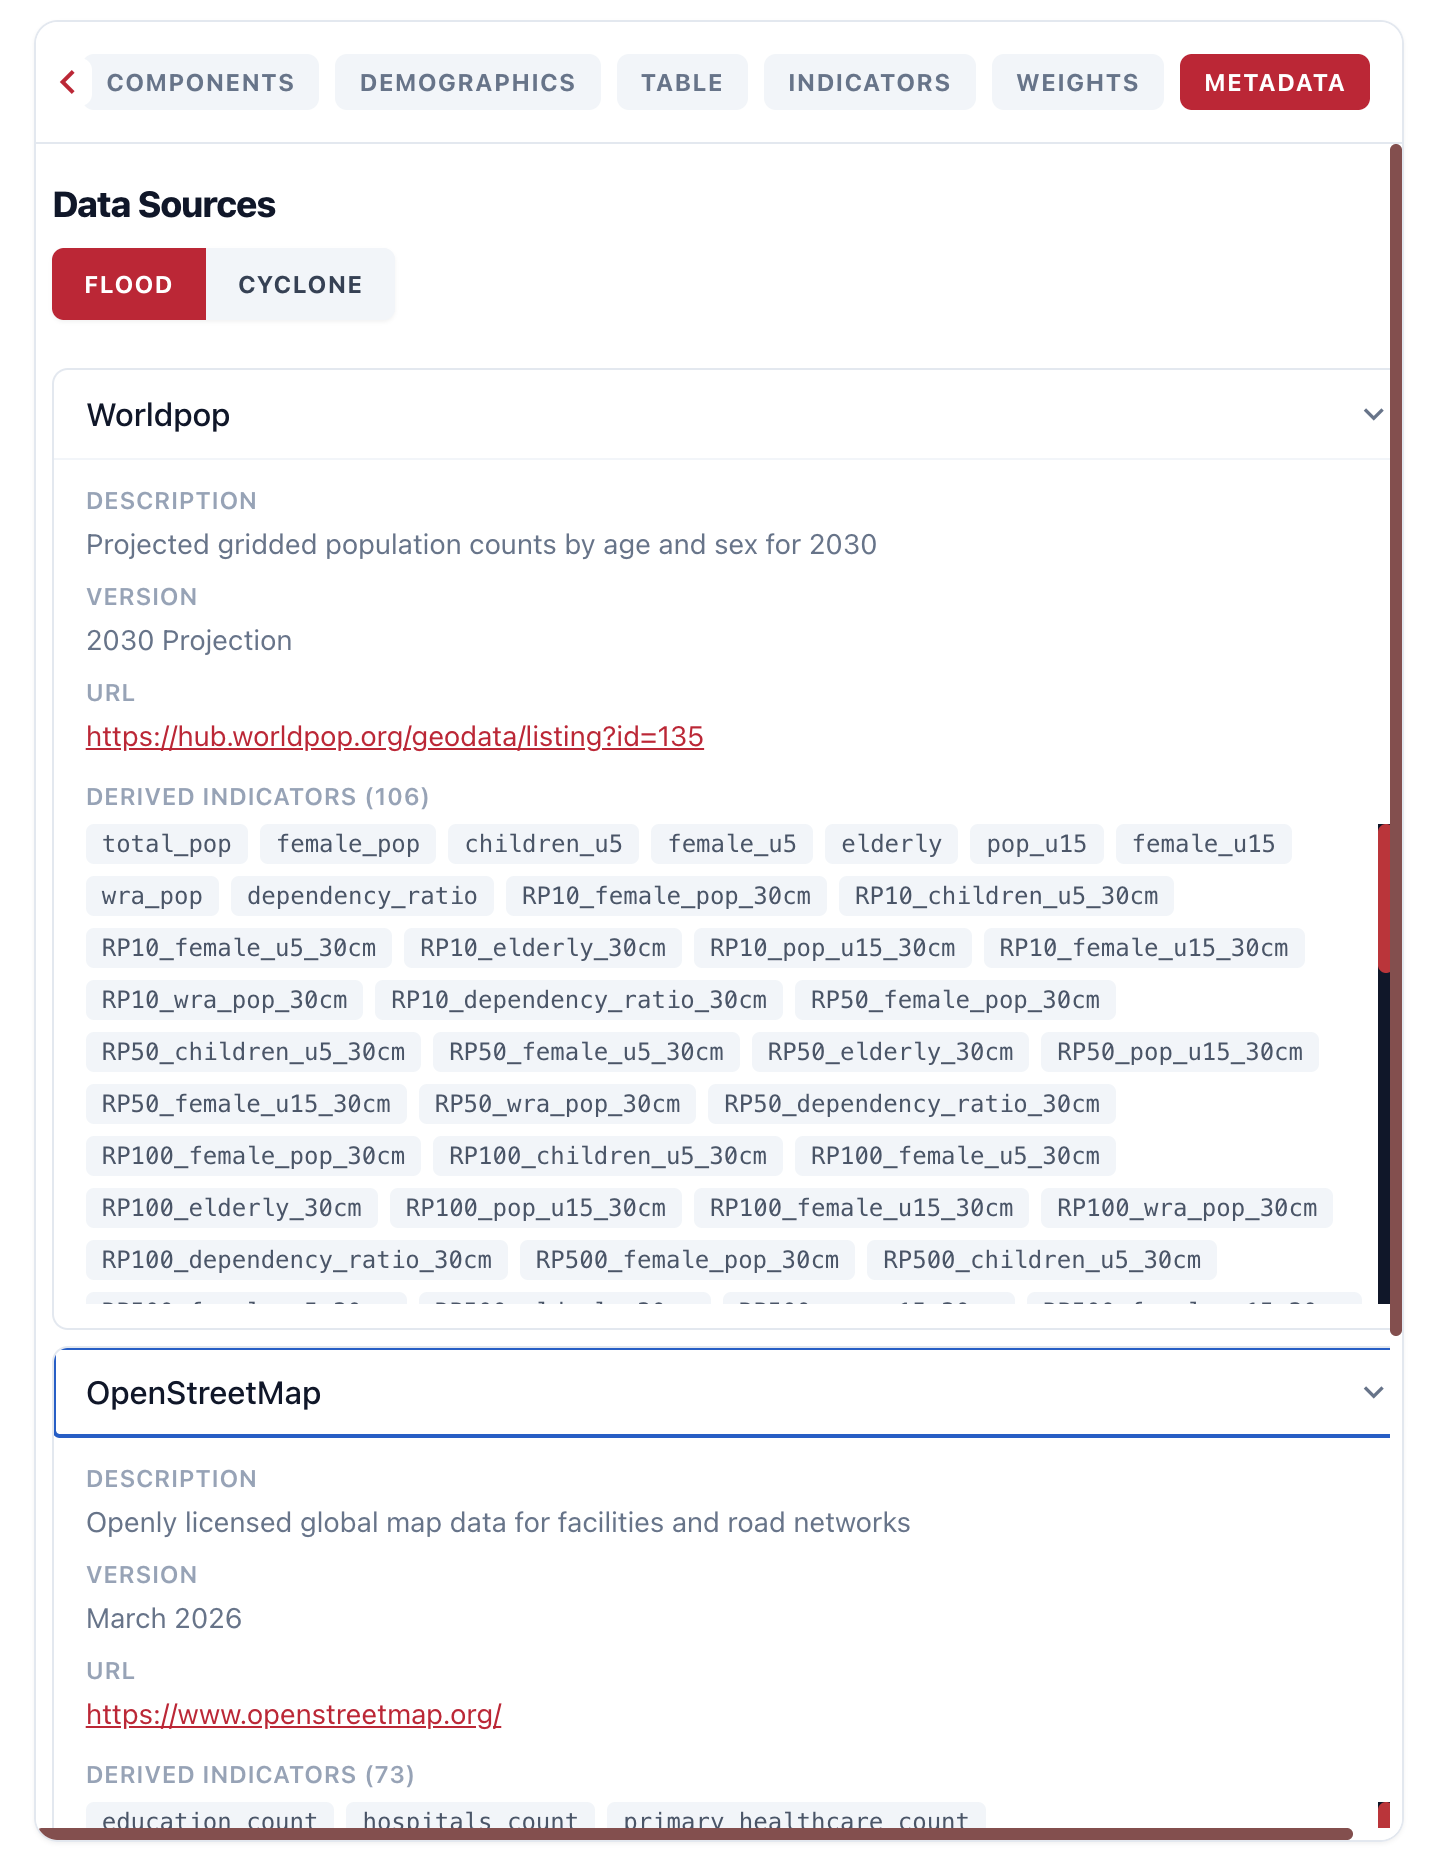
Figure 3.0 DIRC indicator Metadata and Trust Panel view
DIRC Story Map Configuration
For the DIRC Story Map, my duty was to design and configure the layout so that disaster risk information could be communicated to users in a clear, narrative format. Rather than building a one-off layout, I configured the story map to be reusable, so the same structure and components can be adapted for future story maps built at HeiGIT beyond DIRC.
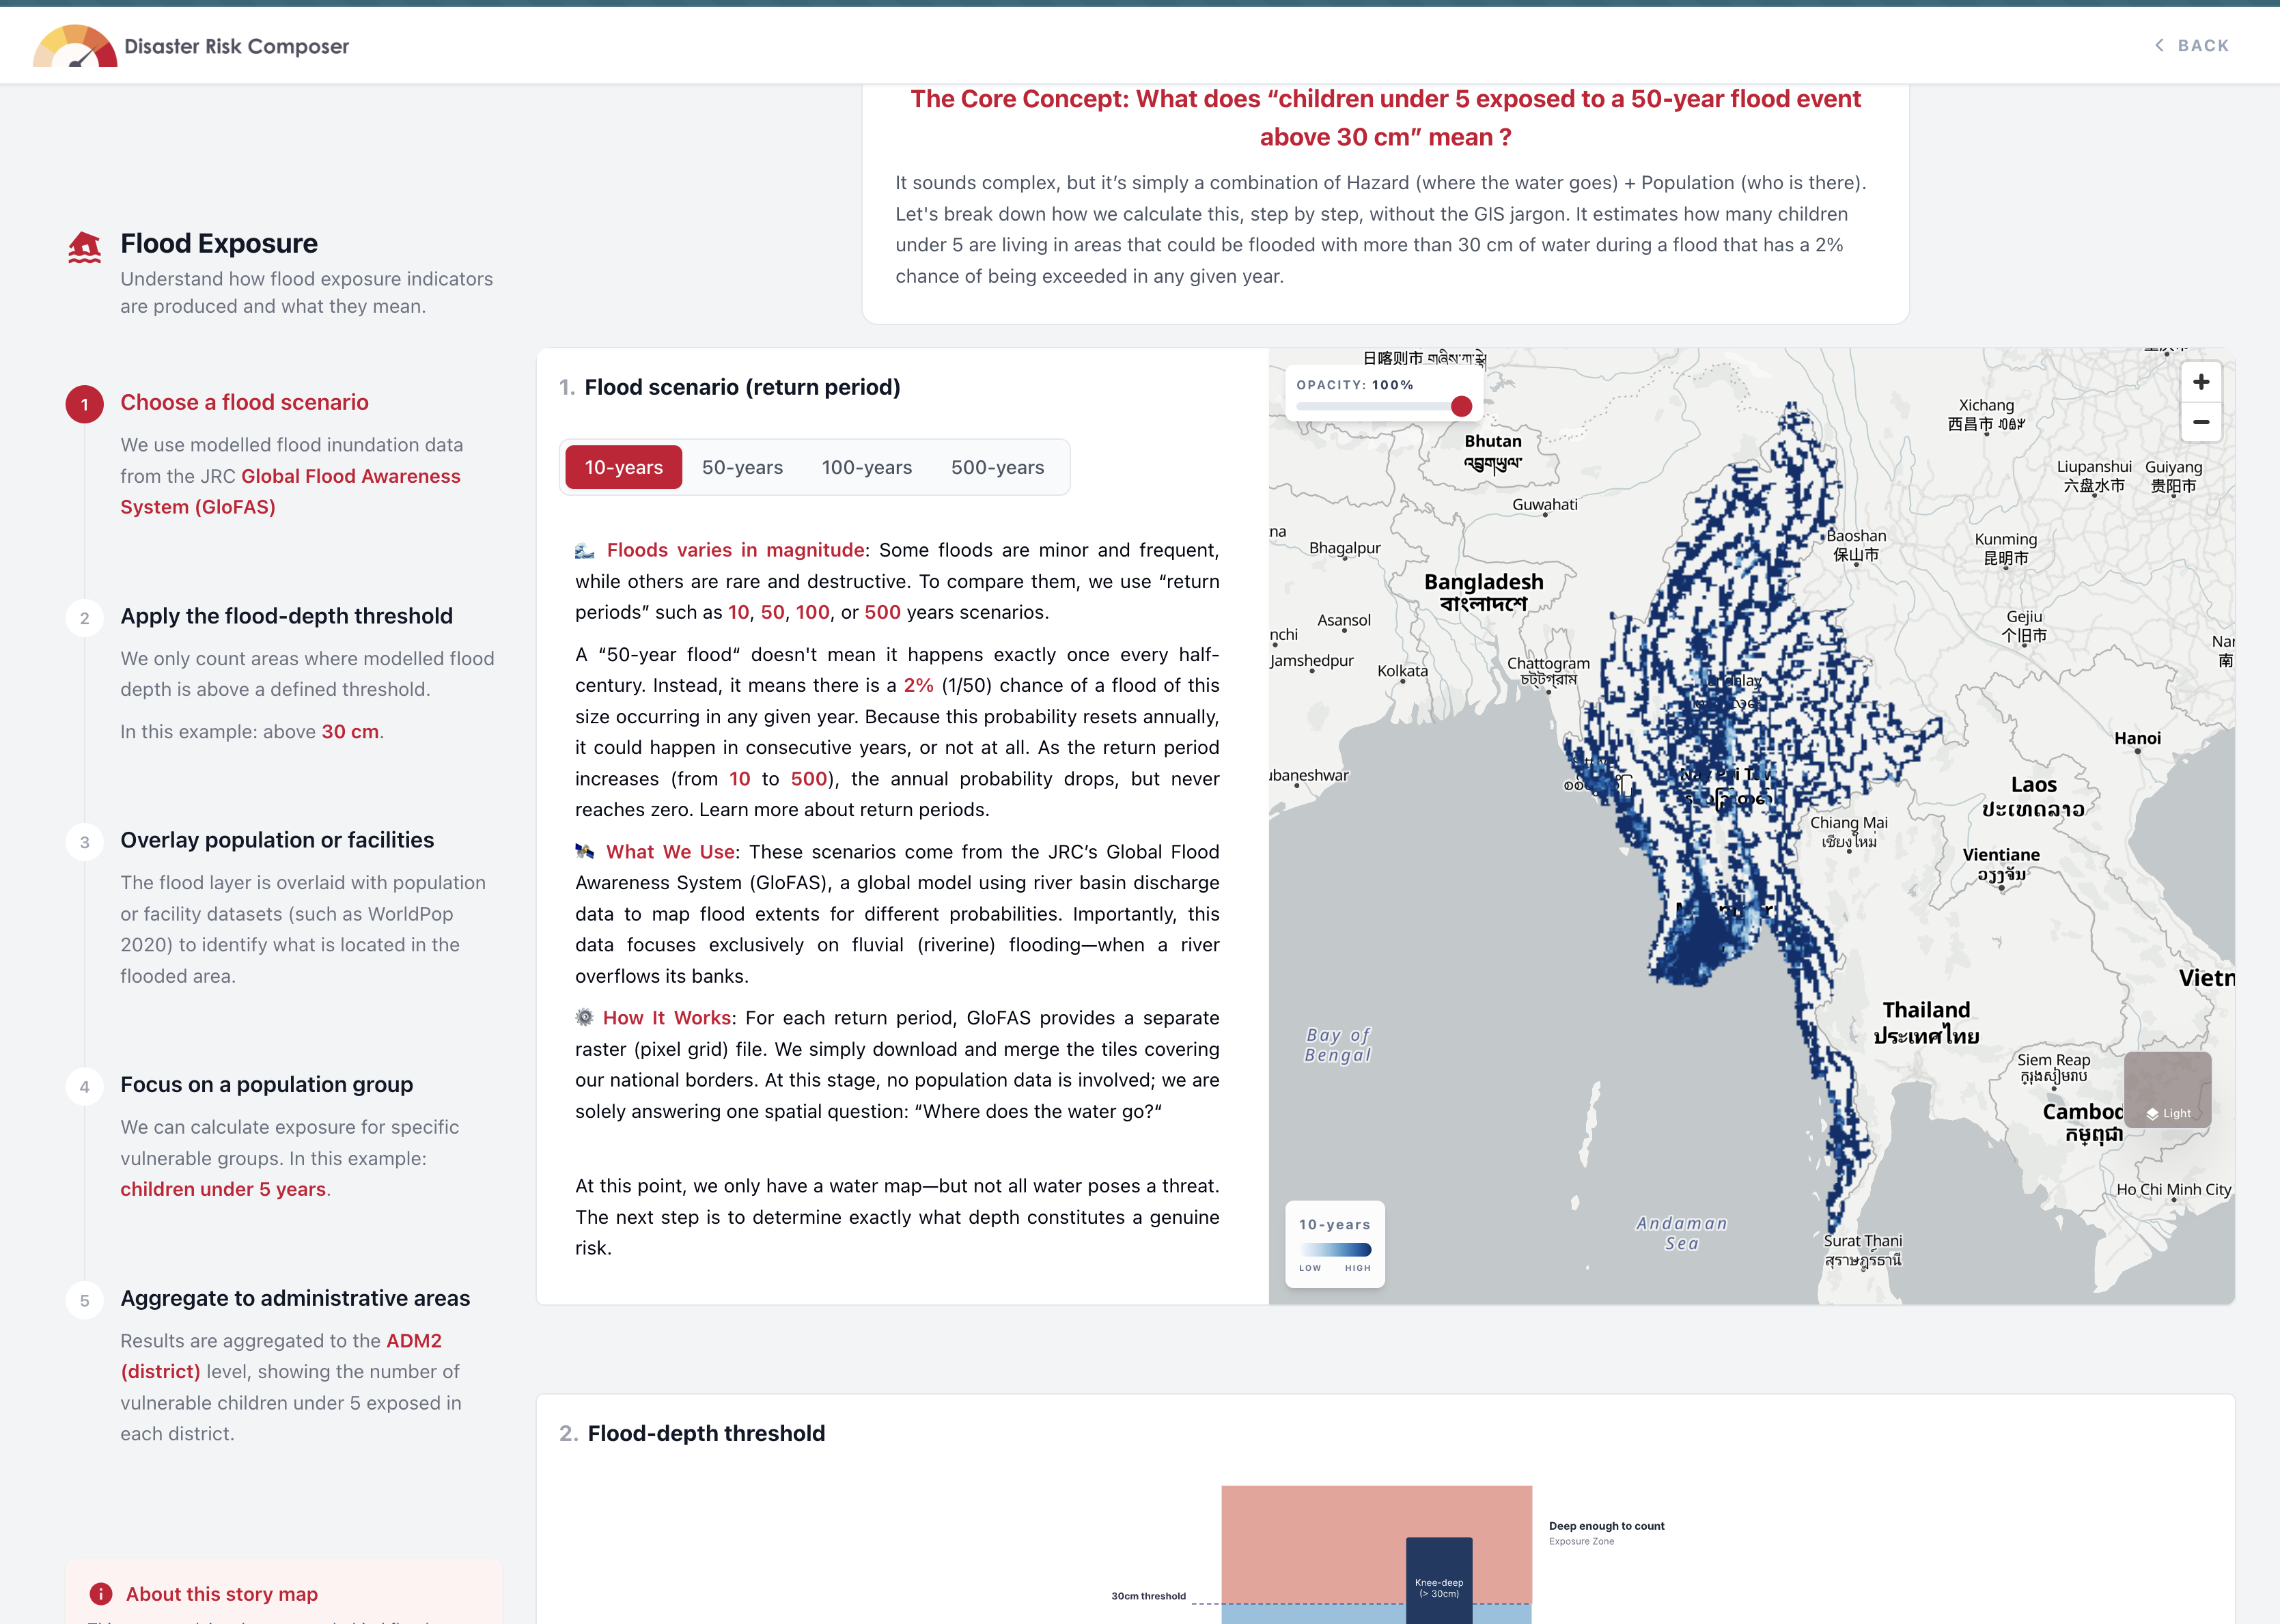
Figure 4.0 Interactive DIRC StoryMap Layout View [Note: Not yet available on production]
Geospatial Pipeline for Natura2000 Imperviousness
This project is a continuation of my Analysis and Modelling Seminar work and I choose to build a geospatial pipeline, orchestrated with Dagster, that aggregates imperviousness data for Natura2000 protected areas across different countries under the supervision of Marcel Maurer .This involved processing raster imperviousness data, aggregating it at the country level, and structuring the output so it could be used for further analysis of land surface sealing within protected natural areas.
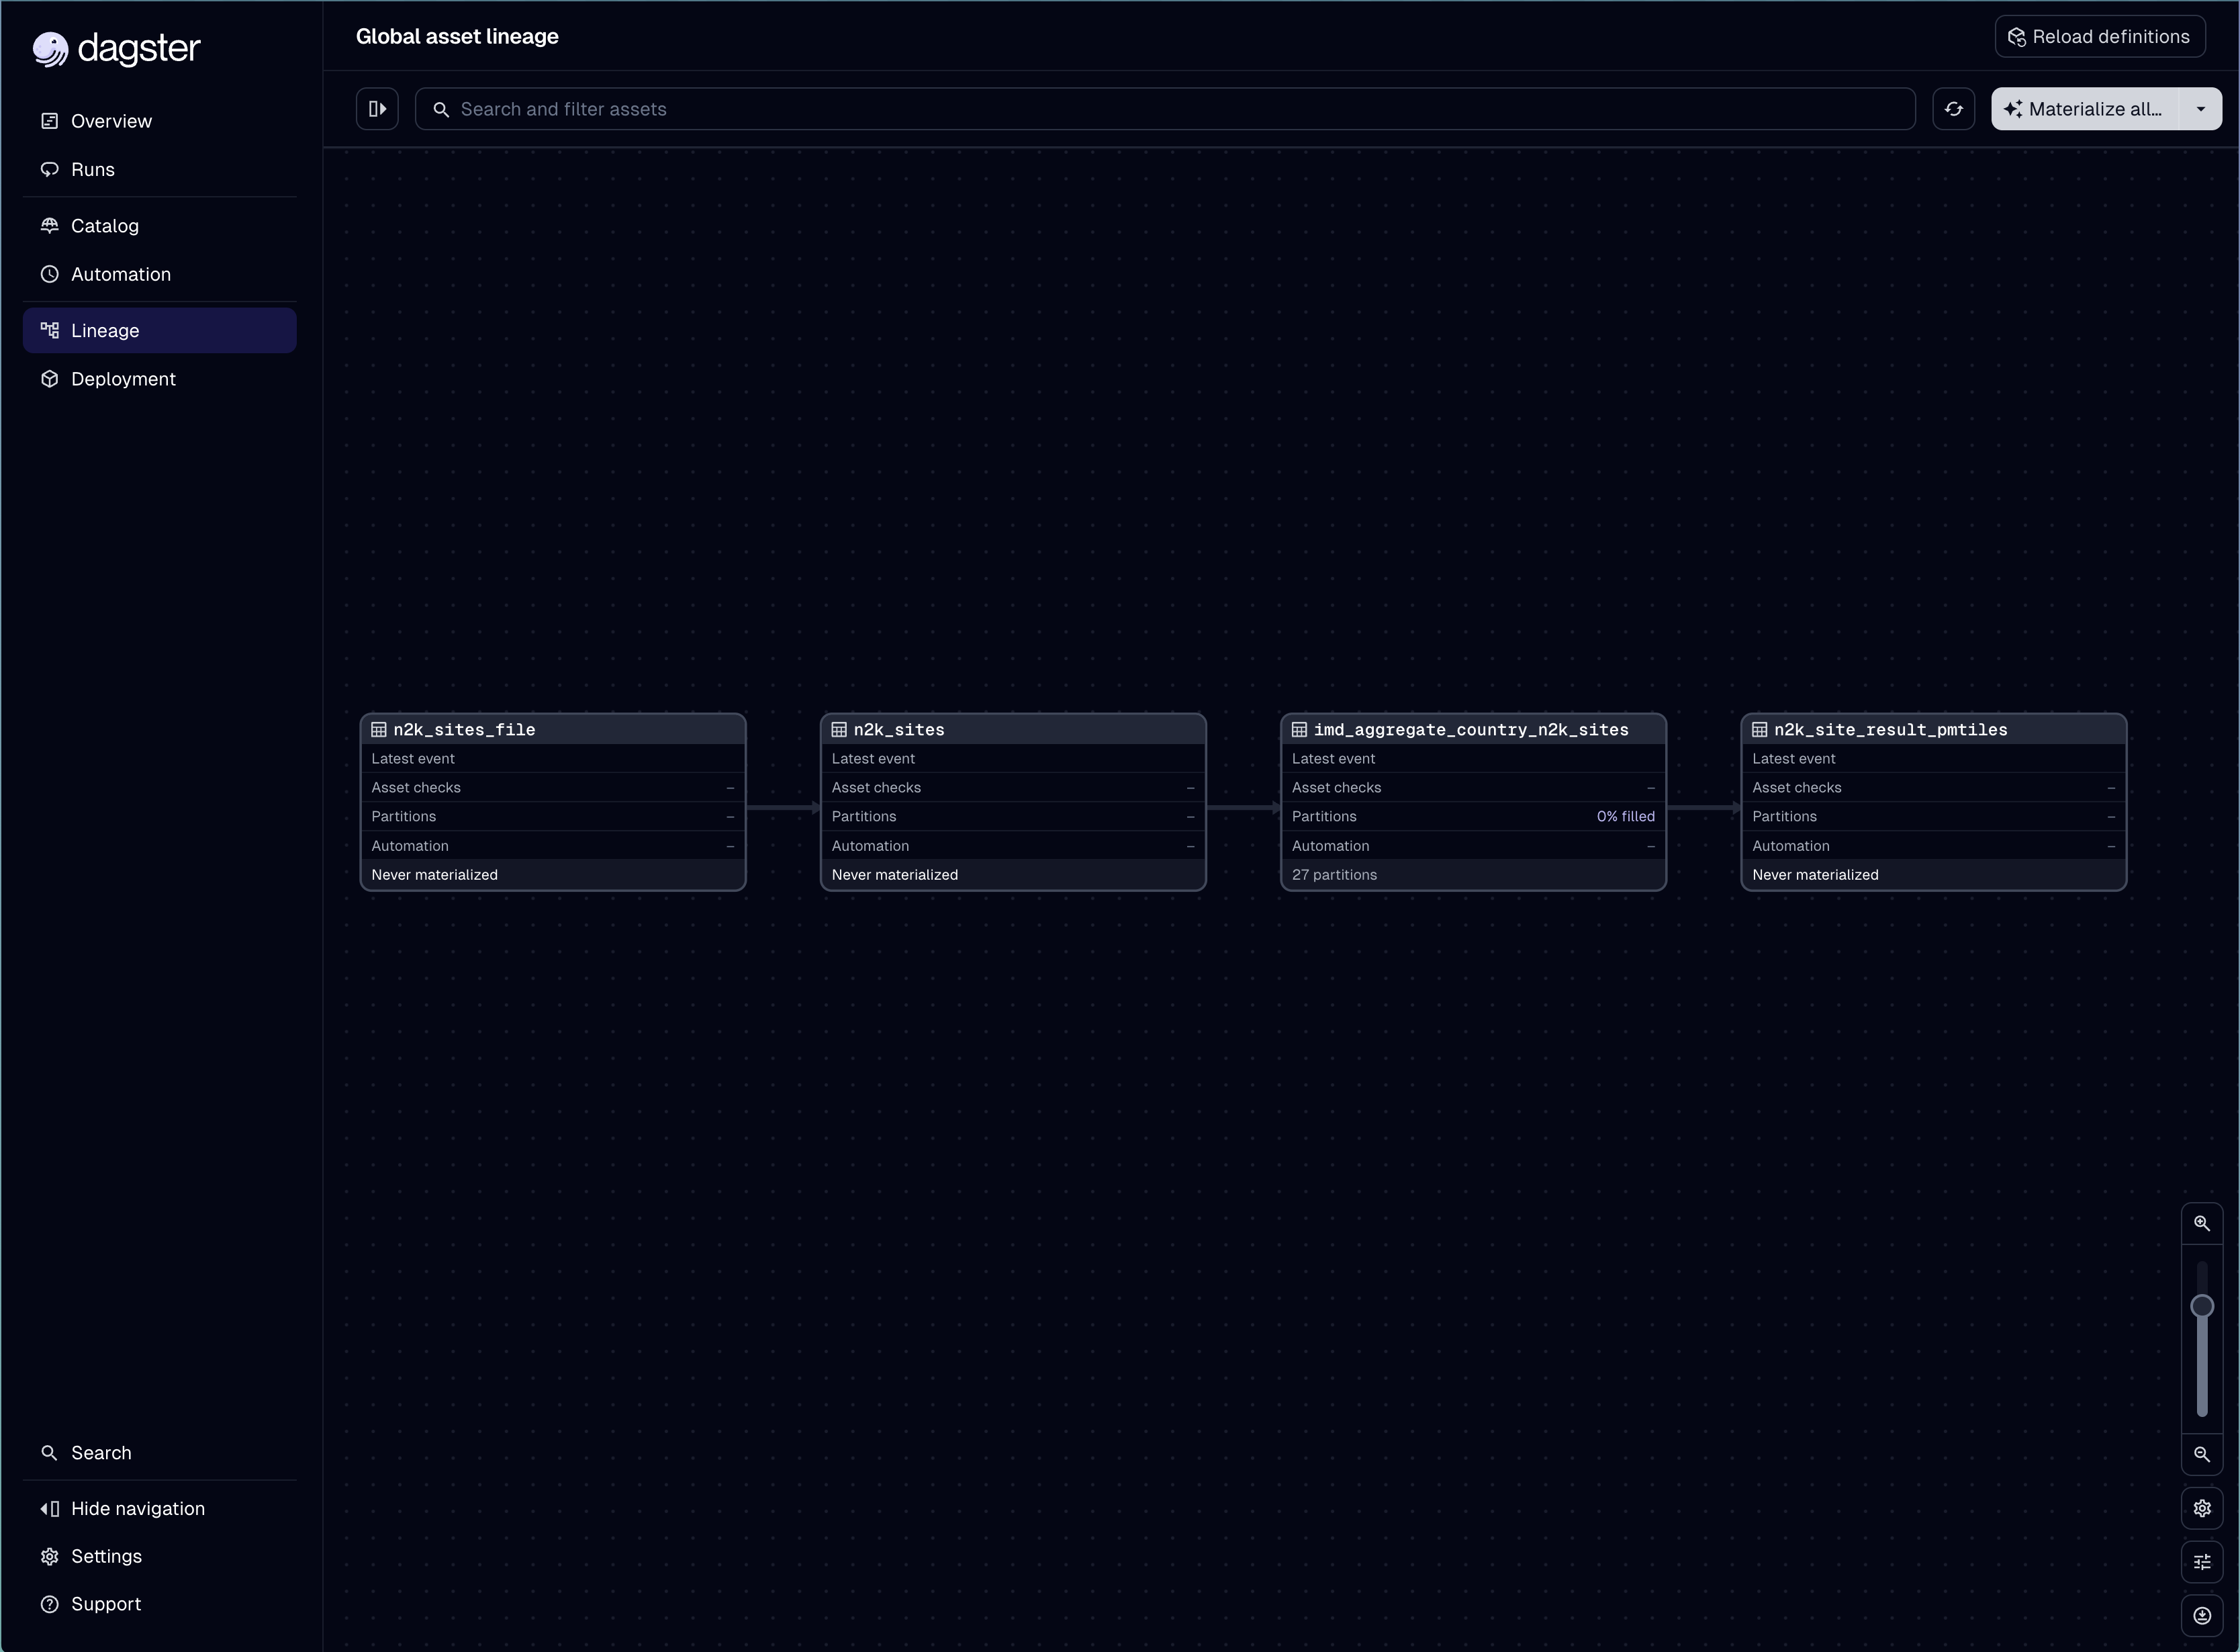
Figure 5.0 Lineage of Natura200 imperviousness geospatial pipeline on Dagster
Tools, Software and Equipments Used
Throughout my internship, I worked with a range of tools and technologies to support development and deployment of the projects I contributed to. Key tools included:
- RustFS for data storage
- Dagster for orchestrating geospatial data pipelines
- Python for ETL processes and data analysis
- JavaScript and the Vue.js framework for frontend development
- Maplibre
- GitHub and Gitlab for version control, collaboration, and deployment workflows
- Confluence for project documentation and sharing
- Claude code for development container environment
4.2 Outcomes
The features I worked on for the DIRC Dashboard, including the Risk Dimensions view, the Indicator Metadata and Trust Panel, the custom indicator weighting upload, and the explanatory tooltips, have been deployed to production and are now publicly accessible at the Disaster Risk Composer. This does not include the DIRC Story Map layout and configuration which content is being reviewed and updated.
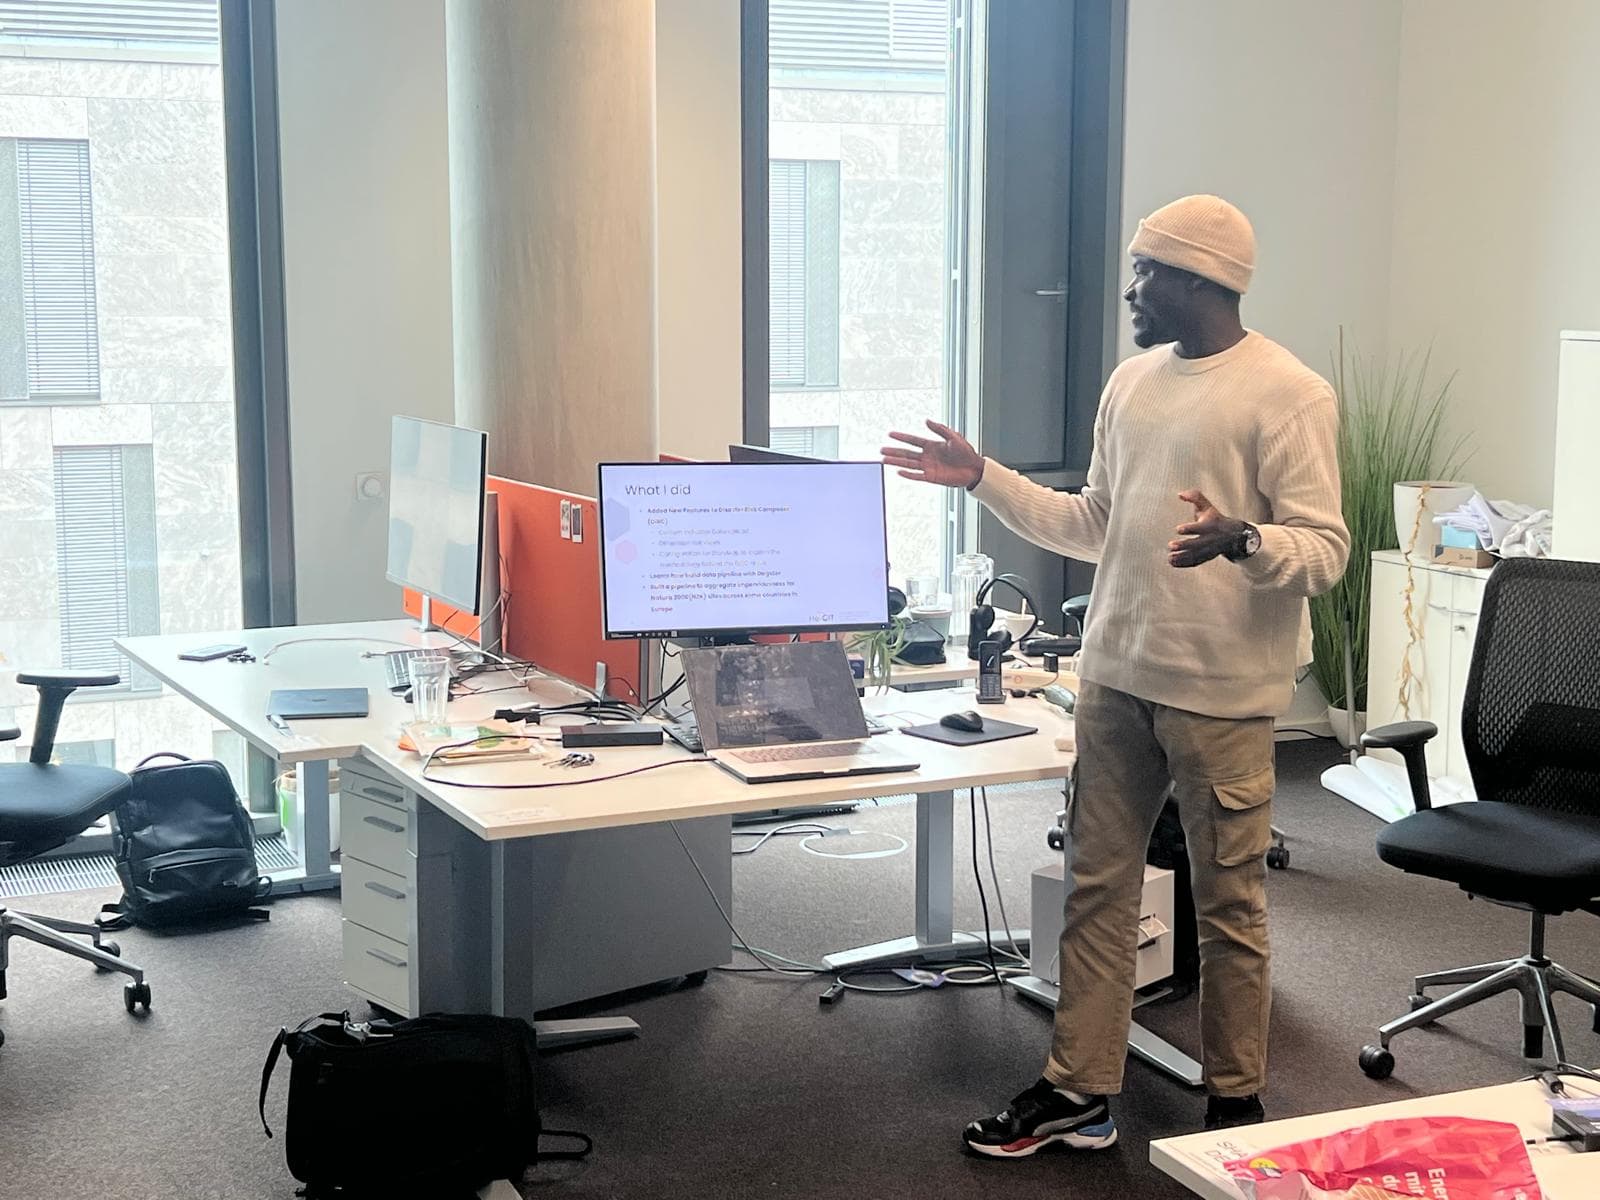
Towards the end of my internship, I presented these new features to the entire HeiGIT team, walking through the functionality I had built and the reasoning behind key design decisions. The presentation slides are available here.
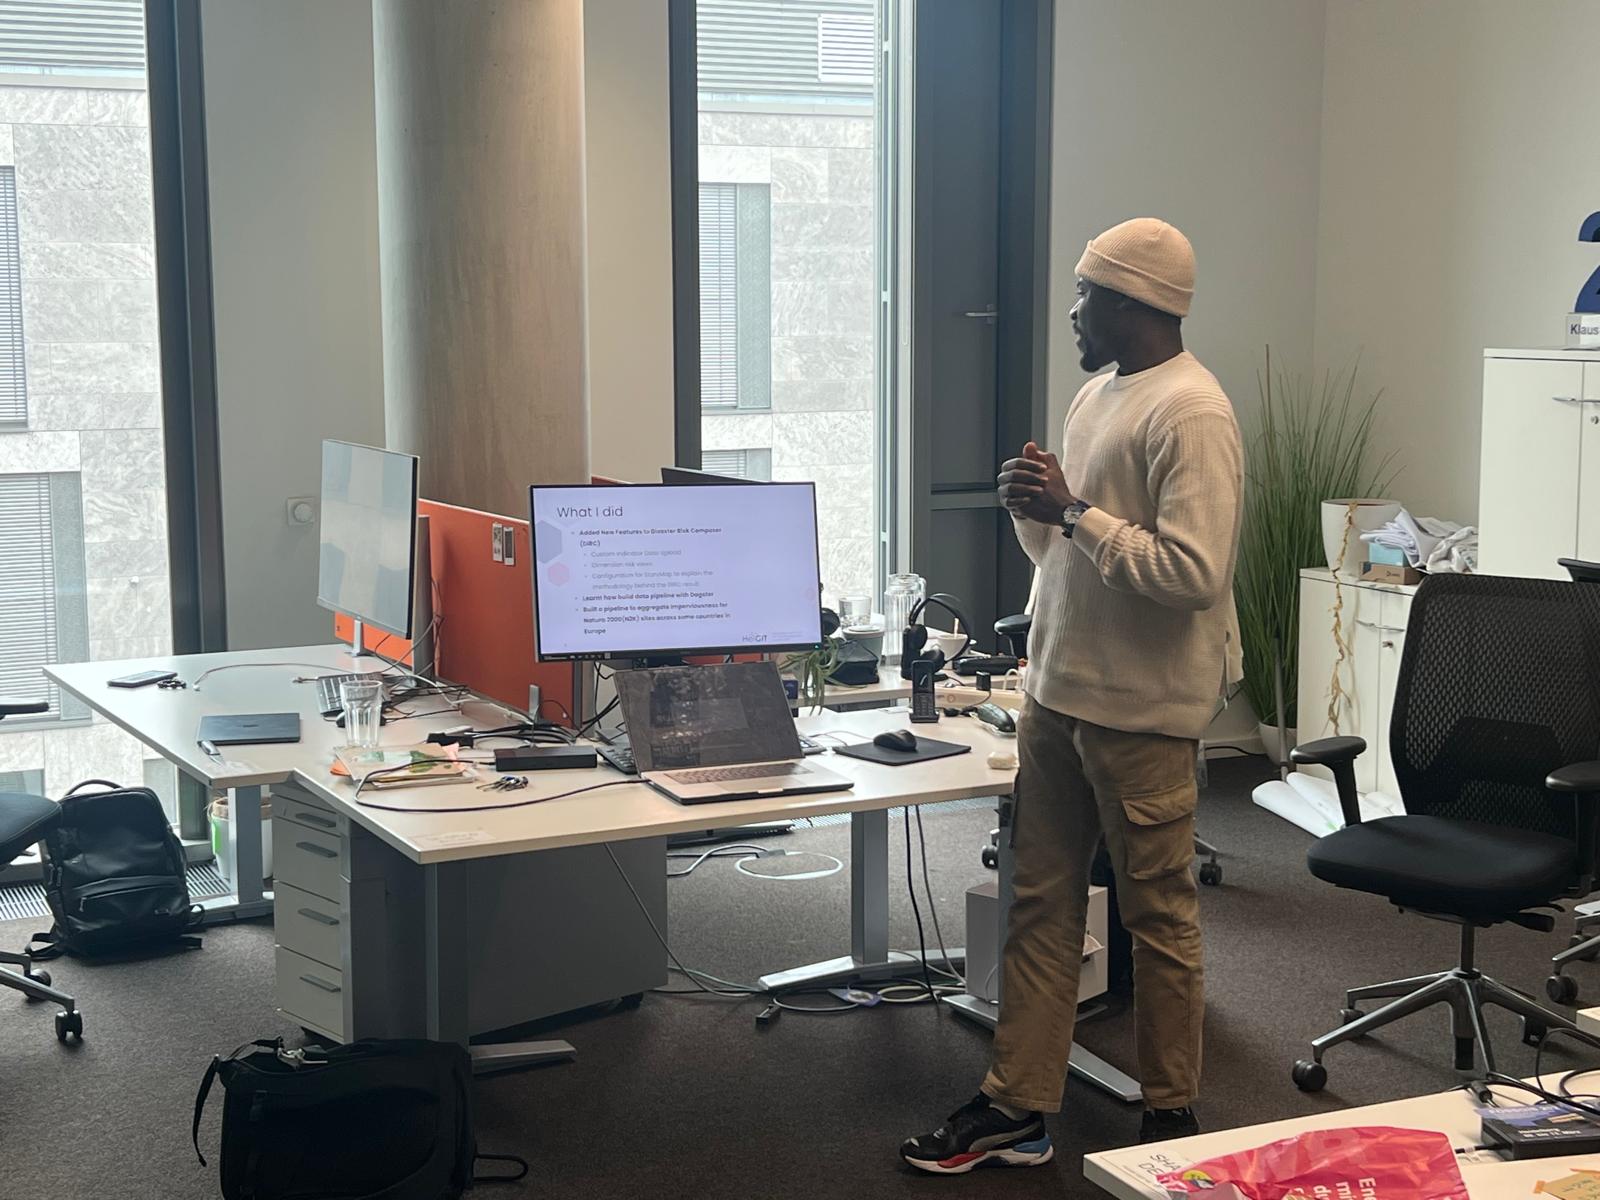
Figure 6.0 Internship presentation to HeiGIT Team on what I did
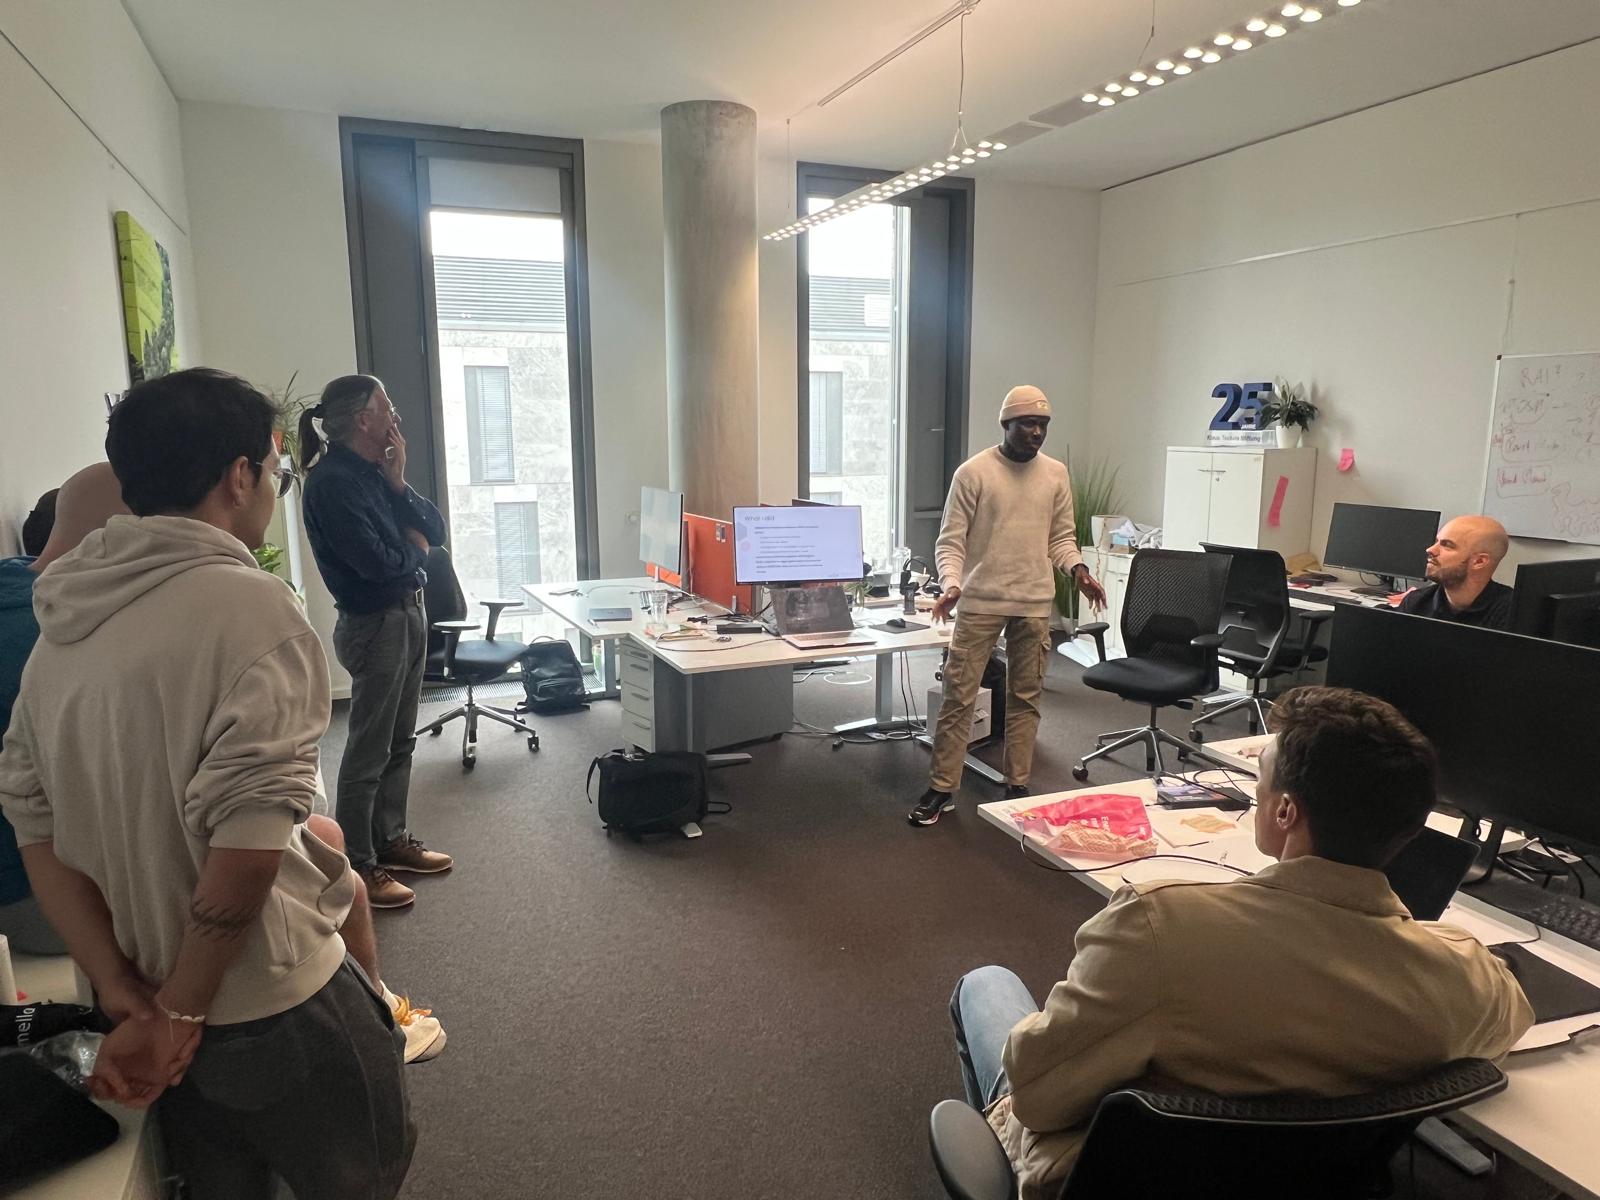
Figure 6.0 Internship presentation to HeiGIT Team on what I did
The geospatial pipeline for aggregating Natura2000 imperviousness data is available as an open source repository on GitHub, where it can be reviewed, reused, and extended for further analysis.

Figure 7.0 Wishes gift from HeiGIT based on my contribution to the team
Self Evaluation and Reflection
Strengths and Weaknesses of Experience
One of my biggest strengths during this internship was my technical ability. I picked up new tools and frameworks, such as Dagster, Vue.js, and handling raster data, relatively quickly, and was able to apply my existing JavaScript and Python skills effectively to deliver working features on the DIRC Dashboard, Story Map, and geospatial pipeline.
An area I found more challenging was communication and collaboration, particularly in a professional team setting with established workflows and multiple stakeholders. Coordinating effectively across the weekly DIRC updates, team meetings, and the Monthly Jour Fixe, and clearly communicating technical decisions to colleagues with different backgrounds, took more conscious effort than the technical work itself. This is an area I want to continue improving, since strong communication is just as important as technical skill in a collaborative engineering environment.
Alignment with Career Goals
This internship confirmed that I want to continue building my career in geospatial frontend development. Working hands-on with dashboards, WebGIS portals, and interactive tools like the DIRC Dashboard and Story Map, as well as building the geospatial pipeline, gave me a clear example of the kind of work I find most engaging and want to keep pursuing.
Beyond frontend work, I also discovered a genuine interest in geospatial workflow building, particularly designing pipelines and reproducible workflows, which opened up a new direction I hadn't fully considered before this internship. Rather than shifting my overall direction, the experience gave me a clearer sense of the specific niches, frontend development for geospatial and WebGIS applications, and geospatial pipeline and workflow engineering, that I want to specialize in going forward.
Overall Learning Impact
Overall, this internship had a significant impact on both my technical growth and my professional outlook. It gave me the opportunity to apply theoretical knowledge from my studies to real production systems used in humanitarian response, while also exposing me to the practical realities of working in a professional engineering team, including collaboration, communication, and coordinating work across multiple projects at once.
I leave this internship with stronger technical skills, a clearer sense of the career direction I want to pursue, and a better understanding of the areas, particularly communication and collaboration, that I want to keep developing going forward.
6.0 Challenges and Lessons Learned
One of the main challenges I faced was getting up to speed with tools I had limited prior experience with, particularly Dagster for orchestrating the geospatial pipeline and handling different raster data formats when rendering them on the web map. Bridging the gap between the theoretical remote sensing knowledge I had from my coursework and the practical demands of building a working, production-ready pipeline required additional self-study and close collaboration with more experienced colleagues.
Another challenge was balancing multiple parallel workstreams, DIRC development and pipeline development, while staying aligned with the team through the various recurring meetings. This required me to improve my time management and prioritization skills over the course of the internship.
To address these challenges, I made use of team resources such as the weekly DIRC update meetings to ask questions and validate my technical approach before implementation, and relied on documentation and pair discussions with colleagues like Alec, Valentin when I got stuck. The main lesson I took from this was the value of asking for feedback early and often, rather than trying to solve every problem independently, which ultimately helped me deliver features that met both technical and user needs.
Recommendations to Future Interns
Based on my experience, I would offer the following recommendations to future interns at HeiGIT:
- HeiGIT offers interesting machine learning related projects alongside geospatial development work, so it is worth exploring these opportunities if you are interested in applying ML to humanitarian or environmental problems.
- Note that working student positions at HeiGIT generally require you to be based in Germany and eligible for paid employment there, so it is worth checking your eligibility early if you are interested in continuing beyond an internship.
- Familiarize yourself with the core tools used by the team, such as JavaScript/Vue.js, Python, and Dagster, before starting, as this will help you get up to speed faster.
- Take full advantage of the recurring meetings, especially the weekly meeting, to ask questions and get feedback on your technical approach early, rather than waiting until a feature is complete.
- Don't hesitate to reach out to colleagues for guidance. The team is collaborative and supportive of interns learning new tools and workflows.
References
- HeiGIT. (n.d.). About HeiGIT. Retrieved September 3, 2026, from https://heigit.org
- HeiGIT. (n.d.). Disaster Risk Composer (DIRC) [Dashboard]. Retrieved September 3, 2026, from https://giscience.github.io/Disaster-Risk-Composer/#/