
Visualizing Change Over Time: Temporal Analysis of the Dadia Forest Wildfire
- Published on
- Authors

- Name
- Victor Ademoyero
- @vickystickz
The Challenge
One of the most effective applications of Big Earth Data is the ability to visualize change over time. For this project, I focused on a significant environmental event: the wildfires that ravaged Greece in the summer of 2023. Specifically, I utilized the SplitPanel Widget in Google Earth Engine to create a comparative interface for analyzing the destruction of the Dadia Forest.
Event Background
In July 2023, multiple wildfires broke out across Greece, exacerbated by human negligence and arson. The situation worsened significantly on August 22, 2023, when a major fire erupted near Alexandroupolis in the Dadia Forest. Fueled by intense winds, the fire became difficult to contain, leading to mass evacuations and significant ecological damage.
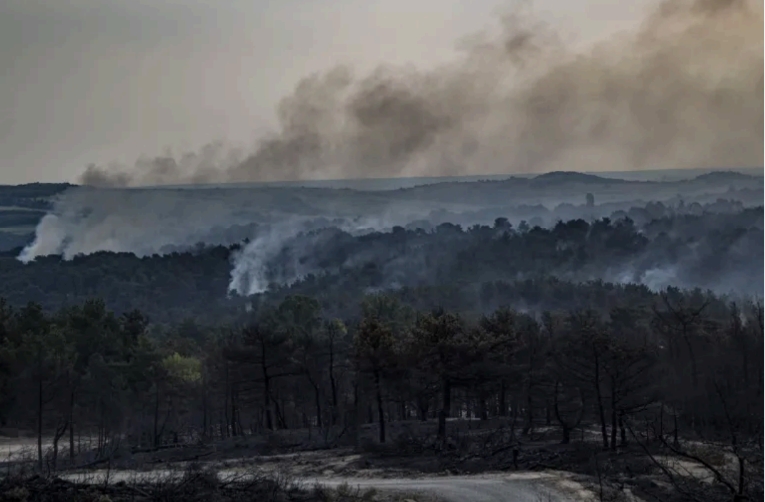
Methodology
To visualize the impact of this event, I modified a Google Earth Engine script to compare satellite imagery from immediately before and after the peak of the fire.
I chose NDVI (Normalized Difference Vegetation Index) as the primary metric. NDVI is ideal for this analysis because it highlights healthy vegetation in high values (bright/green) and burnt or barren areas in low values (dark/brown).
Technical Parameters
The following parameters were used to configure the GEE script:
- Location: Diada Forest (
26° 10' 1.21" N, 41° 6' 44.78" E) - Satellite Source: Sentinel-2 Harmonized (
COPERNICUS/S2_HARMONIZED) - Cloud Tolerance: Max 25%
- Timeframe:
- Before Event: July 28–30, 2023
- After Event: September 11–13, 2023
- Analysis Metric: NDVI
- Visualization Range:
-1.0(Burnt) to1.0(Vegetation)
The Solution: GEE SplitPanel Widget
The core of this visualization is the SplitPanel Widget. This tool allows users to overlay two georeferenced images and slide a divider back and forth to compare them instantly.
By mapping the "Before" collection to the left side and the "After" collection to the right side, the tool provides a stark visual representation of the deforestation.
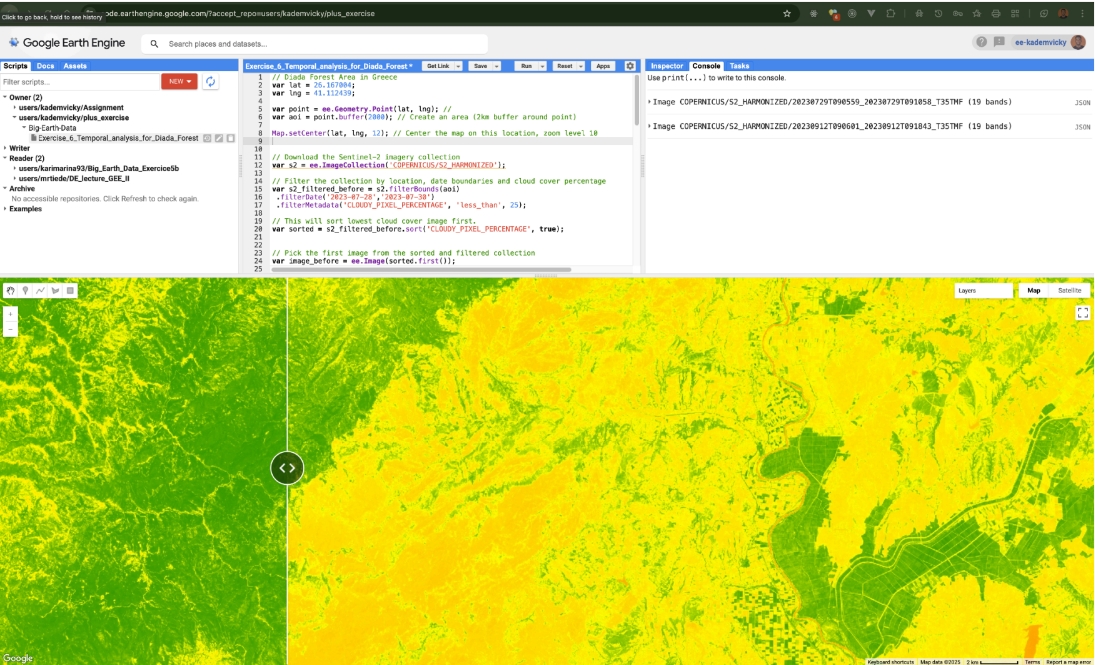
Results
The temporal analysis revealed a drastic change in the landscape. The NDVI layer from July (left panel) showed dense, healthy vegetation. In contrast, the September layer (right panel) revealed massive scars across the forest, indicated by significantly lower NDVI values. This workflow demonstrates how quickly Big Earth Data can be processed to assess disaster impact without the need for heavy local file storage.
Resources
- Script Repository: View the GEE Code Here (Exercise 6)
References
- Al Jazeera (2023): Greece wildfire kills 18 suspected asylum seekers in Dadia region, 22 August.
- Wikipedia Contributors (2023): 2023 Greece wildfires.
- Dirk, T. (2025): Digital Earth Lecture GEE scripts. Google Earth Engine Repository.