
Remote Sensing on the Fly: Implementing Custom Indices for Sentinel Data in EO Browser
- Published on
- Authors

- Name
- Victor Ademoyero
- @vickystickz
Unlocking Satellite Insights: Custom Urban Classification on Sentinel-2 Data
The Objective
Remote sensing offers a powerful way to monitor land use, but standard visualizations (like True Color) often fail to distinguish specific surface features clearly. The goal of this project was to leverage the script repository from Sentinel Hub to perform a rapid, holistic classification of a specific region.
For this case study, I applied the Urban Classified script to the region of Salzburg, Austria, to differentiate between built-up urban infrastructure, vegetation, water bodies, and barren soil.
The Methodology: How the Script Works
The "Urban Classified" script (originally by Monja Šebela) operates by calculating specific spectral indices and combining them with raw band data. It utilizes the Sentinel-2 L2A bands to calculate NDWI (Normalized Difference Water Index) and NDVI (Normalized Difference Vegetation Index).
The script utilizes the following logic:
- NDWI Calculation: Uses B03 (Green) and B08 (NIR) to detect water.
- NDVI Calculation: Uses B08 (NIR) and B04 (Red) to measure vegetation health.
- SWIR Analysis: Uses B11 (Short Wave Infrared 1) to help identify built-up areas.
The Classification Logic
The script applies conditional statements to classify pixels based on specific threshold values:
- Vegetation: Pixels with NDVI > 0.2.
- Built-up Areas: Pixels where SWIR 1 > 0.8 OR NDVI < 0.1.
- Water: Pixels with NDWI > 0.2.
- Barren Soil: Pixels that do not fit the above criteria.
Implementation Workflow
Using the Copernicus Browser, I executed the analysis directly in the browser without downloading massive datasets. Here is the step-by-step workflow:
- Region Selection: I zoomed into the Salzburg region of Austria.
- Data Selection: I chose the Sentinel-2 L2A product to ensure atmospherically corrected data.
- Time Series: I filtered for an acquisition date of September 29, 2025, selecting a scene with relatively low cloud cover (20%) to ensure surface visibility.
- Custom Scripting: Instead of using a preset visualization, I navigated to the "Custom" layer option and injected the JavaScript code.
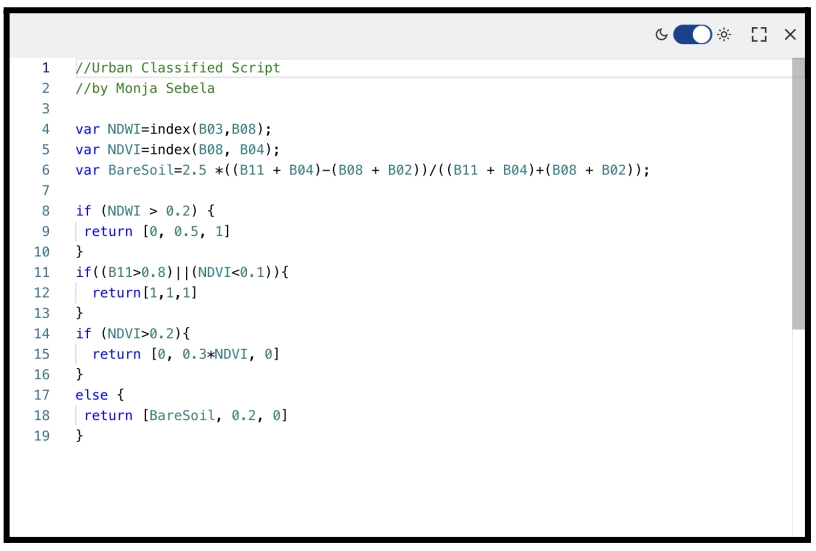
The Code Snippet
Below is a representation of the logic used in the custom script box:
// Urban Classified Script logic
// Based on Monja Sebela's work

var NDWI = index(B03, B08);
var NDVI = index(B08, B04);
var BareSoil = 2.5 * ((B11 + B04) - (B08 + B02)) / ((B11 + B04) + (B08 + B02));

// Classification Thresholds
if (NDWI > 0.2) {
    return [0, 0.5, 1]; // Blue for Water
}
if ((B11 > 0.8) || (NDVI < 0.1)) {
    return [1, 1, 1]; // White for Built-up Areas
}
if (NDVI > 0.2) {
    return [0, 0.3 * NDVI, 0]; // Green for Vegetation
}
else {
    return [BareSoil, 0.2, 0]; // Brown/Dark for Barren Soil
}
Analysis of Results
The script produced a sharp, categorized visualization of Salzburg. The results were color-coded for immediate interpretation:
- Blue: clearly defined the Water bodies (Salzach river).
- Green: highlighted the dense Vegetation surrounding the city.
- White: sharply delineated the Built-up Areas (urban infrastructure and buildings).
- Brown: identified areas of Barren soil.
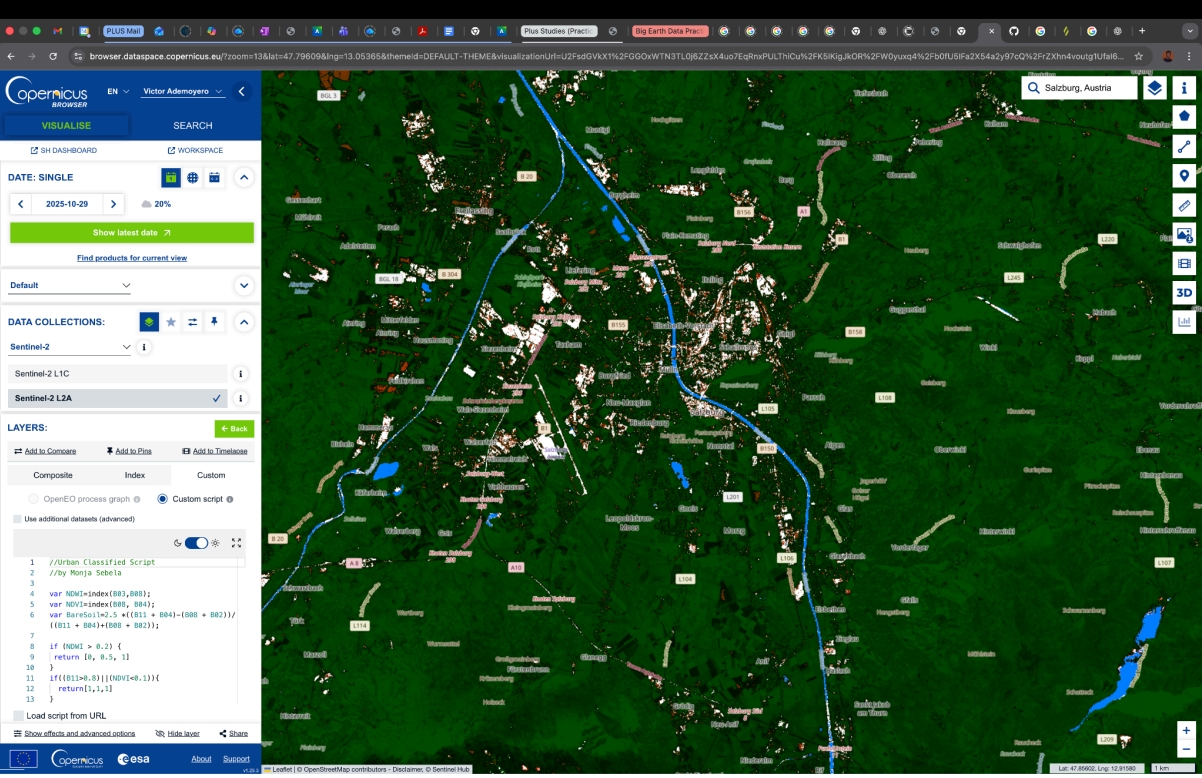 Fig 2.0 NDWI, NDVI, BarrenSoil and B11 (SWIR 1) for urban classification of Salzburg, Austria. Acquired on 29.10.2025, processed by Copernicus Browser.
This method proved to be highly effective for a quick, "on-the-fly" land cover classification. It eliminates the need for complex desktop GIS processing for preliminary analysis, allowing for immediate visual assessment of urban sprawl vs. natural environment.
References
- Script Source: Monja Šebela (2020), Sentinel Hub Custom-Script GitHub Repository.
- Repository Link: Sentinel Hub Custom Scripts - Urban Classified